


JMLS 2023 June;8(1):68-77. 10.23005/ksmls.2023.8.1.68 Epub 2023 June 16
Copyright © 2023 by The Korean Society of Marine Life Science
Quantitative Analysis of Microplastics in Coastal Seawater of Taean Peninsula using Fluorescence Measurement Technique
Un-Ki Hwang; Marine Environment Research Division, National Institute of Fisheries Science (NIFS), Busan 46083, Korea
Hoon Choi; Ocean and Maritime Digital Technology Research Division, Korea Research Institute of Ships & Ocean Engineering (KRISO), Daejeon 34103, Korea
Ju-Wook Lee; West Sea Fisheries Research Institute, National Institute of Fisheries Science (NIFS), Incheon 22383, Korea
Yun-Ho Park; West Sea Fisheries Research Institute, National Institute of Fisheries Science (NIFS), Incheon 22383, Korea
Wonsoo Kang; Ocean and Maritime Digital Technology Research Division, Korea Research Institute of Ships & Ocean Engineering (KRISO), Daejeon 34103, Korea
Moonjin Lee; Ocean and Maritime Digital Technology Research Division, Korea Research Institute of Ships & Ocean Engineering (KRISO), Daejeon 34103, Korea
- Abstract
본 연구에서는 형광측정기법을 사용하여 태안반도 인근 8지점의 표층 해수 내 미세플라스틱 정량분포를 조사하였다. 연구결과 미세플라스틱의 검출범위는 0~360.5 particles/l (평균 149.7± 46.0 particles/l)로 나타났다. 하지만 해양환경 내 미세플라스틱의 정량분석방법이 표준화되지 않아 타 연구결과와 직접비교 하는 것이 불가능한 상황이다. 본 연구결과 검출된 미세플라스틱을 크기별로 분류하면 < 50 μm 크기가 우점하지만, St. 3의 경우 > 500 μm이 25.6%를 차지하여 지역별로 우점하는 미세플라스틱의 크기에 차이가 나타난다. 또한 채집지역, 저질의 종류, 검출되는 플라스틱 크기에 따른 미세플라스틱의 검출량 비교에도 뚜렷한 상관관계를 가지는 요인을 확인할 수 없었다. 이는 플라스틱의 재질에 따른 물리 · 화학적 특성, 해양의 동적 조건(해류, 바람, 파도, 조류 등), 지질학적 특성(지형, 경사 등), 연안 생물을 포함한 저질의 구성 및 특성, 상호작용, 인간활동(어업, 개발, 관광 등), 기상조건(홍수, 강우 등)과 같은 다양한 요인이 미세플라스틱의 거동에 영향을 주기 때문이다. 그러므로 향후 정량분석방법 표준화 및 환경요인에 대한 분석이 수반된 미세플라스틱 모니터링 기초연구가 필요한 상황이다.
In this study, we investigated the quantitative distribution of microplastics in the surface seawater at 8 points near the Taean Peninsula using fluorescence staining. The study revealed a detection range of microplastics from 0 to 360.5 particles/l, with an average of 149.7 ± 46.0 particles/l. When classifying the microplastics by size, it was found that particles smaller than 50 μm were dominant, although there were differences at Site 3. Moreover, it was not possible to identify clear correlations when comparing the number of microplastics based on collection area and particle size. Various physical and chemical factors, including plastic material, dynamic ocean conditions (such as currents, wind, waves, tides), geological characteristics (topography, slope), sediment materials including coastal organisms, human activities (fishing, development, tourism), and weather conditions (floods, rainfall), affect the behavior of microplastics. Therefore, future efforts should focus on standardizing quantitative analysis methods and conducting fundamental research on microplastic monitoring, including the analysis of environmental factors.
Keywords: Microplatic(미세플라스틱) Quantitative screening(정량 스크리닝) Fluorescence measurement technique(형광측정기술) Taean peninsula(태안반도) Surface water(표층수)
Correspondence to: Hoon Choi; Ocean and Maritime Digital Technology Research Division, Korea Research Institute of Ships & Ocean Engineering (KRISO), Daejeon 34103, Korea
- Received
- 30 January 2023;
- Revised
- 4 February 2023;
- Accepted
- 8 May 2023.
This is an Open Access article distributed under the terms of the Creative Commons Attribution Non-Commercial License (http://creativecommons.org/licenses/by-nc/3.0/) which permits unrestricted non-commercial use, distribution, and reproduction in any medium, provided the original work is properly cited.
Language: Korean/English,
Full Text:

서 론
플라스틱은 일반적으로 석유, 가스 또는 석탄 유래 단량체의 중합반응에 의해 생성되는 유기 중합체이며(Koelmans et al., 2014; Dong et al., 2020; Gardon et al., 2018), 가볍고, 내구성이 뛰어나며, 값이 싸기 때문에 포장, 건축, 자동차, 전자 및 전기제품, 의류, 농업 등 인간 생활의 거의 모든 영역에 널리 사용된다. 이처럼 다양한 목적에 의해 플라스틱 생산량은 지난 수십 년 동안 지속적으로 성장하였으며 연간 최대 2억 4천만 톤에 이르는 상황이다(Mathalon and Hill, 2014; Mendoza and Balcer, 2019; Plastics Europe, 2019). 과도한 플라스틱 생산은 플라스틱 쓰레기의 증가로 이어졌으며, 플라스틱 쓰레기의 40%는 환경으로 유입되며, 해양으로의 유입량은 2025년까지 1~2억 5천만 톤으로 예상되는 상황이다(Barnes et al., 2009; Alimi et al., 2018; Huerta Lwanga et al., 2018; Ng et al., 2018; Jambeck et al., 2015). 한번 생산된 플라스틱이 버려지고 환경 내에 유입되면 UV 노출, 생물분해, 물리적 스트레스 등을 포함하는 다양한 풍화과정을 통해 점차 더 작은 조각으로 조각화 될 수 있으며, 이 과정을 통해 작은 조각으로 부서진 플라스틱을 2차 플라스틱이라고 한다(Barnes et al., 2009; Stolte et al., 2015; Arthur et al., 2009; Thompson et al., 2004; Browne et al., 2008; Andrady, 2011). 이처럼 다양한 과정을 통해 환경 내에서 작은 조각으로 부서지거나, 생산 당시부터 작게 제조되어 5.0 mm 이하로 존재하는 플라스틱 입자나 파편을 미세플라스틱이라고 한다(Guo et al., 2018).
이러한 미세플라스틱은 매년 245톤에 가까운 양이 생성되며, 퇴적물, 해변 및 해안선을 포함한 전 세계 해역의 거의 모든 환경에서 발견되지만(Thompson et al., 2004; Gallagher et al., 2016; Auta et al., 2017), 내구성으로 인해 분해되는 데 100년 이상이 걸리며 생태계에 심각한 영향을 미치고 인간의 건강 문제를 야기하기도 한다(Cole et al., 2011; Wang et al., 2016). 그럼에도 미세플라스틱은 해양환경에서 어디서나 볼 수 있어(Shim and Thompson, 2015), 다양한 해양환경에서의 미세플라스틱 오염 수준이 전 세계적으로 관찰되었으며(Lusher et al., 2015), 환경 내에서의 거동특성이 매우 복잡하여 분포를 쉽게 예측할 수 없지만, 인구가 많은 지역이나 관광객이 많은 지역과 같이 인간활동이 많은 지역에서 많은 양이 관찰된다(Barnes et al., 2009; Hantoro et al., 2019). 결국 인간의 활동이 집중된 해안 지역에 대한 미세플라스틱 분포연구가 필요한 상황이다.
이처럼 잠재적인 위험이 있는 미세플라스틱에 대해서 다양한 환경에 분포하는 미세플라스틱 분석의 표준방법 정립과 환경 내 분포하는 미세플라스틱의 분포현황과 같은 체계적인 기초연구가 필요하며, 특히 해양 미세플라스틱 관리를 위해서는 위해서는 전국적, 지역적 규모의 공간적 분포, 정량농도, 조성 등을 아는 것이 중요하다(Ng and Obbard, 2006). 이에 다양한 미세플라스틱관련 연구가 진행되고 있으나 미세플라스틱 정량분석방법의 경우 정확성을 높이기 위해 FT-IR, Raman spectrascopy와 같은 값비싼 전문장비의 사용, 전문분석 인력의 필요, 오랜 분석시간 등의 제반사항을 동반하며 발전해 왔다(Desforges et al., 2014; Song et al., 2014; Zhao et al., 2014; Chae et al., 2015; Kang et al., 2015; Enders et al., 2015; Shim et al., 2016; Setälä et al., 2016; Cincinelli et al., 2017; Qu et al., 2018; Luo et al., 2019; Kwon et al., 2020). 그럼에도 값싼 장비의 사용, 전문 인력이 필요하지 않은 측정방식, 빠른 결과도출이 가능한 연구도 미세플라스틱의 정량분포 스크리닝을 목적으로 축적되어야 할 필요성이 있다. 이에 본 연구에서는 다양한 연구 제한점이 존재하지만 비전문가도 손쉽게 수행 가능한 형광측정 기반 미세플라스틱 측정방식을 적용하여 연안 표층수의 미세플라스틱 정량분포 스크리닝을 수행하였다.
우리나라 서해에 위치한 태안반도는 인가 및 농가에서 배출되는 폐수 등 육상의 오염원이 해역으로 직접 유입될 가능성이 있는 해역이며(Park et al., 2021), 강한 조류의 흐름과 수많은 만입지를 형성하고 있는 리아스식 해안으로 복잡한 연안수의 흐름이 존재하여(Jang et al., 2010; Jeong et al., 2014) 오염물질에 분포예측이 어려운 지역이다. 그럼에도 다양한 어류, 패류 등이 양식되어 유통되는 주요한 해역이다. 이에 본 연구에서는 태안반도의 연안 8개 지점에서 샘플링 한 표층 해수를 이용하여 형광측정 기반 미세플라스틱 정량분포를 스크리닝 하고 분석하여 향후 현장중심 미세플라스틱 연구의 기초가 될 수 있도록 하였다.
재료 및 방법
1. 샘플링 지역 및 시료채취
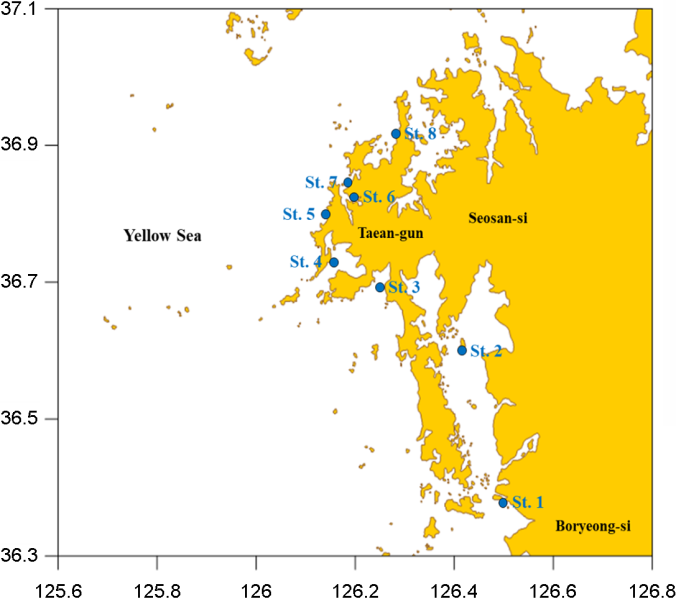
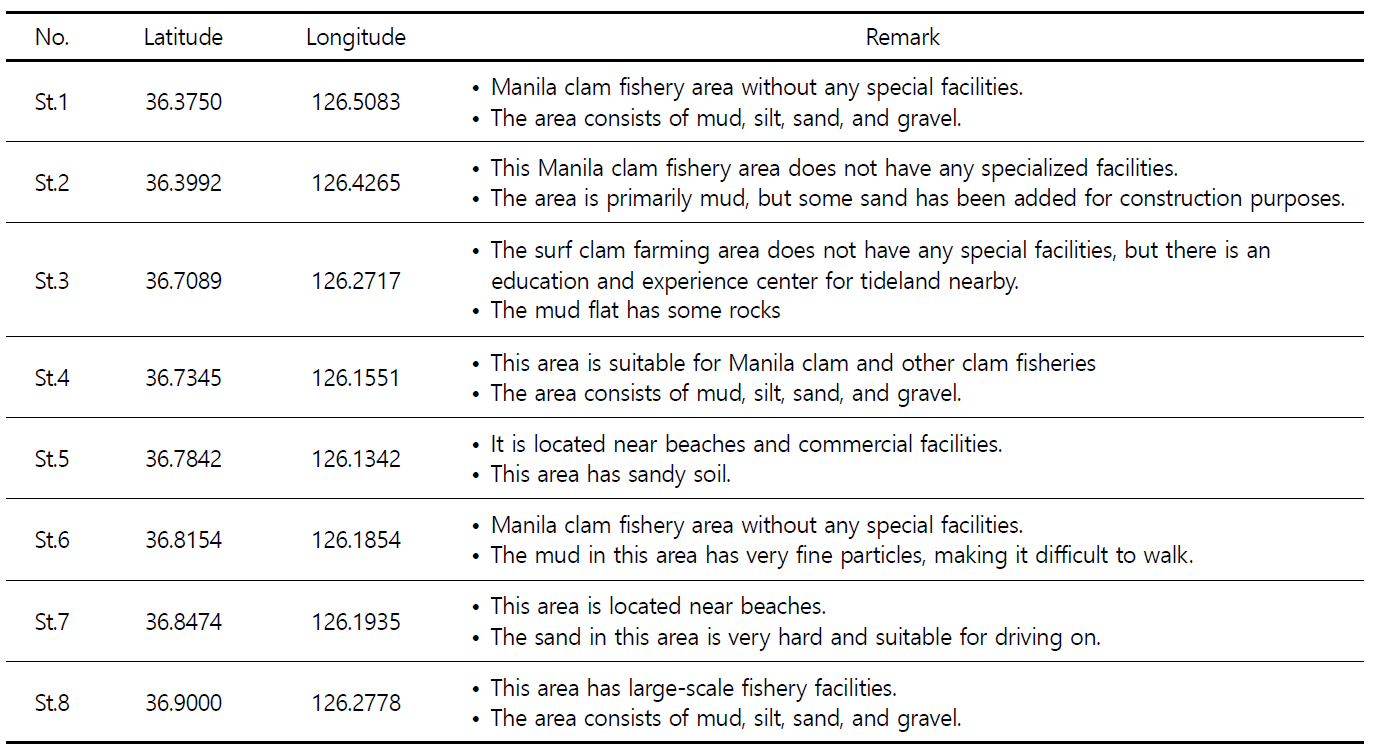
본 연구는 2018년 5월 대한민국 태안반도 인근 8개 연안의 표층 해수를 채취하여 시험에 사용하였다. 8개의 지점의 행정구역상 위치는 충청남도 보령시 주교면 송학리, 서산시 부석면 간월도리, 태안군 남면 진산리, 태안군 소원면 파도리, 소원면 모항리, 소원면 소근리, 원북면 신두리, 이원면 관리이며 지리 정보 및 지도상의 위치는 Fig. 1, Table 1과 같다. 대상 지역에서도 저조선과 고조선을 기준으로 해안선으로부터의 거리를 기준으로 노출시간이 6시간 10분(± 30분)인 지점을 선정하였다. 해안의 지리학적 특징이 지점마다 모두 다르므로, 노출시간은 해안에서부터의 거리를 의미하지는 않는다.
연안유역 해수 샘플링은 표층수를 대상으로 각 정점에서 stain- less steel 재질의 바틀을 이용하여 각 3회씩 채수하여 1.2 ℓ stainless steel 병에 담에 보관하였다. 시료는 채집된 시점부터 냉장 보관되었으며, 실험실로 수송되어 -20℃ 이하에서 냉동 보관하였다. 본 연구에서는 시료를 채취하는 시점부터 stainless steel 또는 glass 재질의 시험기구만을 사용하여 시료의 미세플라스틱 정량분석 시 발생 가능한 간섭을 최소화하였다.
2. 시료 전처리
채집된 표층 해수는 충분히 흔들어 균질화 한 뒤 유리 비커에 신속하게 300 ml씩 나누어 담는다. 유리깔때기에 GF/F 필터를 사용하여 1개씩 필터링 한 뒤, 필터 위의 잔여물을 NaCl2 포화용액으로 신속하게 씻어내어 유리 비커에 담는다. 이때 유리 비커에 담긴 상등액에 NaCl2 포화용액을 추가하여, 미세플라스틱을 포함한 저비중의 물질들을 상층으로 부유시켜 분리한다. 분리된 상등액은 deionized water로 충분히 수세하여 필터 상부에 남은 잔여물질을 획득하였다. 획득한 잔여물질을 35% H2O2에 60℃, 80 rpm, 24 h 동안 반응하여 유기물을 분해한 뒤 GF/F filter 위에서 Ethanol로 세척하여 유리 바이알에 포집한다. 포집된 미세플라스틱은 유리 바이알채로 유산지로 밀봉하여 60℃에서 24 h 완벽하게 건조하였다.
본 연구에서 모든 미세플라스틱을 획득하는 전처리 과정은 clean room 내부에 알루미늄 호일을 덧댄 실험대 위에서 유리와 stainless steel의 실험도구만을 사용하였으며, 모든 실험자는 방진복을 착용하여 공기 중 부유물질의 유입을 최소화하였다. 또한 모든 실험과정과 동일한 조건에서 동일하게 수행한 blank sample을 준비하여 최종정량 분석결과를 보정하여 실험간 발생할 수 있는 오염에 의함 결과값 변동을 최소화 하고자 하였다.
3. 형광 염색 및 분석
충분히 건조된 미세플라스틱 샘플은 유리 바이알 내에서 Nile red로 염색되었다. 염색에 사용되는 Nile red solution은 0.1 mg/l로 희석되어(Carrier solvent: ethanol), 미세플라스틱이 포집된 유리 바이알 내부에 100 μl가 분주 되었다. 이때, 미세플라스틱 염색에 사용되는 Nile red 염색시약의 농도는 사전실험을 통하여 polymer 분자의 염색 정도가 형광현미경으로 관찰하기 수월하며, 관찰 시 염색시약에 의한 간섭이 낮은 적정농도를 탐색하여 선정하였다. 충분히 염색된 미세플라스틱은 Sedgewic chamber에 전량 도포하여 stainless steel 덮개로 덮은 상태에서 건조 후 형광현미경(IX53, Olympus Co. Ltd, Korea)의 TriTC 필터를 사용하여(Tetramethyl- rhodamine, 482 nm excitation, 536 nm emission) 관찰되었다.
미세플라스틱의 크기분석의 경우 Image analyzer를 이용하여 사진을 촬영하고 Motic images plus (Motic Instruments Inc., Hongkong, China) 프로그램을 이용하여 분석하였다. 모든 실험구 및 대조구는 각 3회의 반복수로 분석되었다.
결 과
1. 형광염료 표지 미세플라스틱 관찰
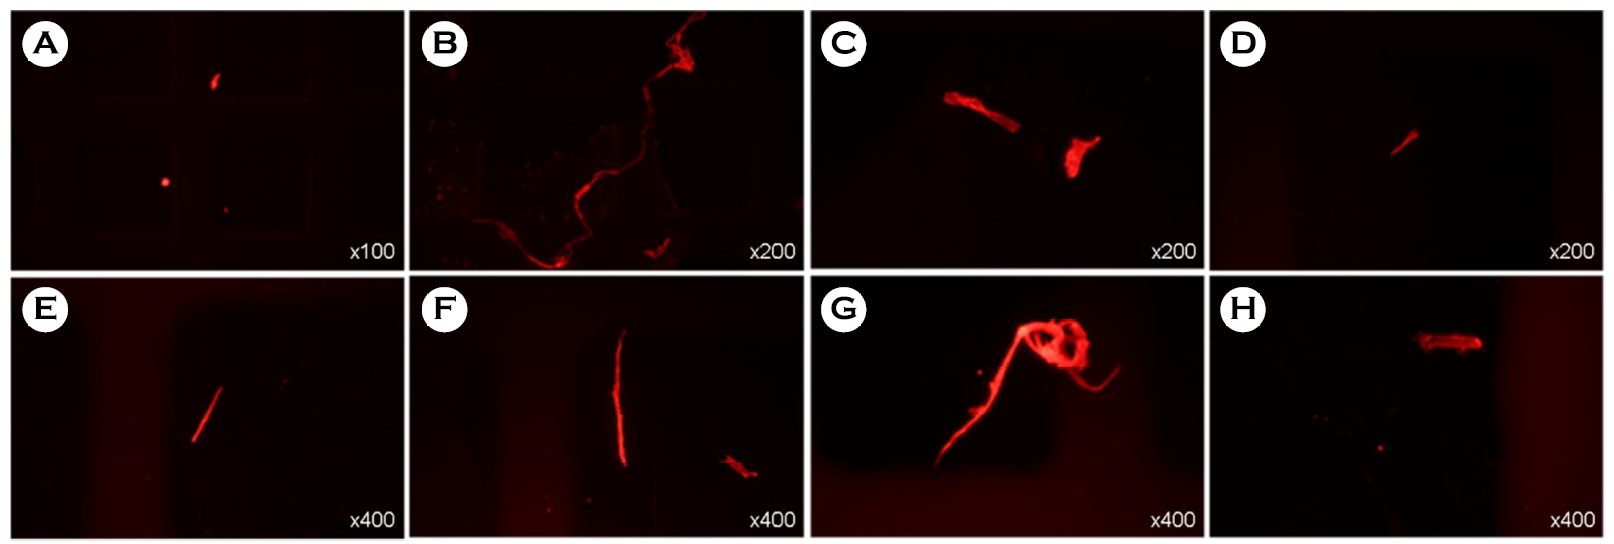
전처리가 완료 및 형광 염색이 완료된 미세플라스틱을 형광현미경 하에서 관찰하면 다양한 크기와 모양의 미세플라스틱이 관찰된다(Fig. 2). 관찰되는 미세플라스틱은 크게 구형(Bead), 파편형(Fragment), 섬유형(Fiber), 판상형(Sheet)의 네 가지로 구분할 수 있다(Choi, 2021). 일부 미세플라스틱의 모양은 미세플라스틱의 발생원 혹은 유입경로를 확인하는데 필요한 정보일 수 있으나, 모양만으로 모든 미세플라스틱의 기원을 확인하는 것은 불가능 하다. 이에 본 연구에서는 미세플라스틱의 정량분석과 크기에 초점을 맞추어 분석하였다.
2. 미세플라스틱 분포
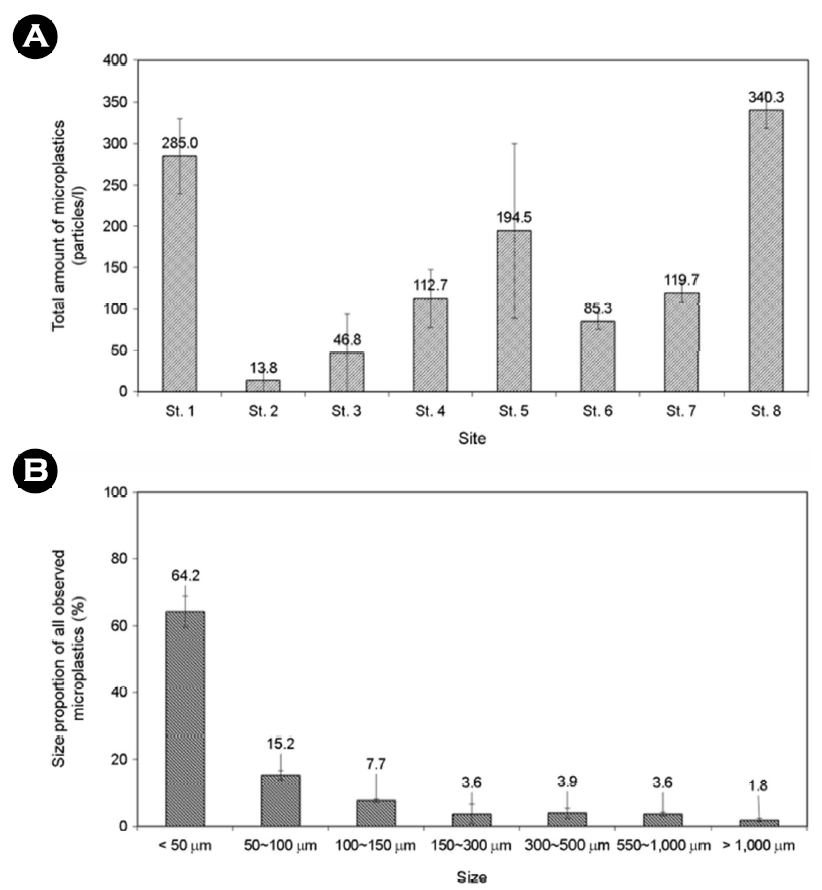
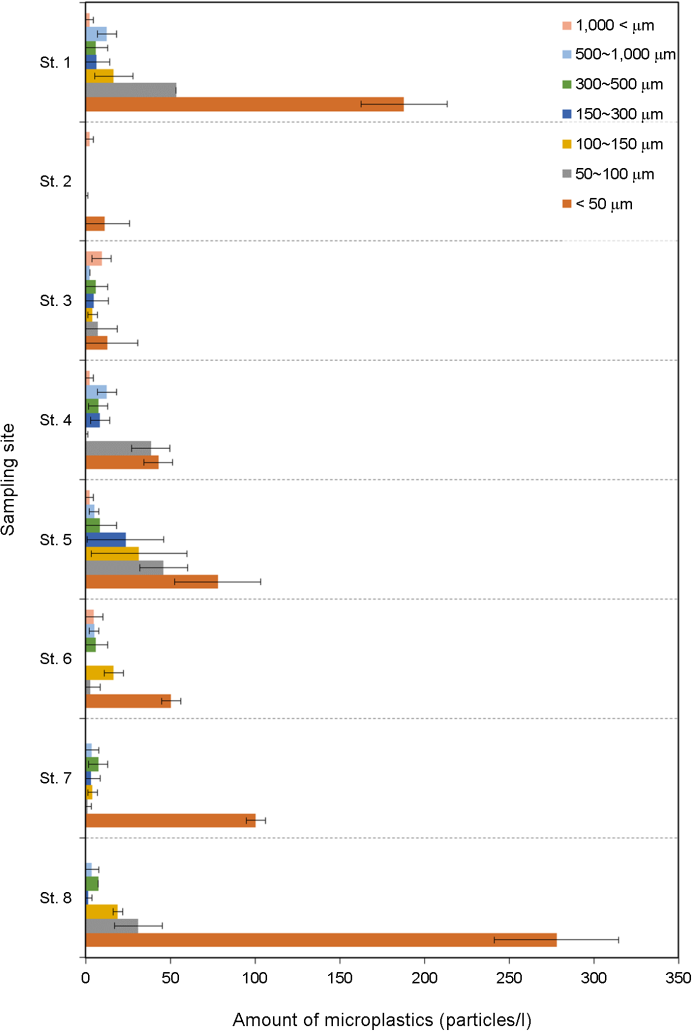
태안반도 인근 8개 연안지역 표층 해수 내 미세플라스틱은 전 지점을 통틀어 반복구당 평균 1,198개가 관찰되었으며 총 3번의 반복구로 분석을 진행했다. 각 지점 별로 St. 1는 285.0 particles/ l, St. 2는 13.8 particles/l, St. 3는 46.8 particles/l, St. 4는 112.7 particles/l, St. 5는 194.5 particles/l, St. 6는 85.3 particles/l, St. 7은 119.7 particles/l, St. 8은 340.3 particles/l의 미세플라스틱이 관찰되었으며, 전체 8개 지점의 평균 미세플라스틱 정량분석 결과는 149.8 particles/l (min: 0, max: 360.5)로 나타났다. 각 표층 해수에서 관찰된 미세플라스틱의 검출량을 높은 순서대로 나타내면 St. 8 > St. 1 > St. 5 > St. 7 > St. 4 > St. 6 > St. 3 > St. 2로 나타났다(Fig. 3A). 또한, 전체 관찰된 미세플라스틱 중 각 크기가 차지하는 비율의 경우 < 50 μm가 64.2%, 50~100 μm 15.02%, 100~150 μm 7.7%, 150~300 μm 3.6%, 300~500 μm 3.9%, 500~1,000 μm 3.6%, > 1,000 μm 1.8%로 나타났다. < 100 μm의 미세플라스틱은 전체 플라스틱 중 79.42%를 차지하며, < 150 μm의 미세플라스틱은 87%를 차지할 정도로 크기가 작을수록 그 검출량이 높으며, 태안반도 주변 연안 표층수 내 미세플라스틱 분포와 미세플라스틱 크기의 관계는 로그 함수 관계가 존재하는 것으로 확인되었다(Fig. 3B).
3. 미세플라스틱 크기별 분포양상
태안반도 인근 8개 지역에서 각각 검출된 미세플라스틱을 크기 별로 분류해보면 지역 별로 차이가 나타난다(Fig. 4). St. 2, 7, 8의 경우 < 50 μm 크기의 미세플라스틱이 80% 이상을 차지하며 우점하는 것으로 나타났으며, 크기범위를 < 100 μm로 하면 St, 1은 84.7%, St, 2는 80.7%, St. 7은 85.0%, St. 8은 90.8%로 나타났으며, < 300 μm로 범위를 설정하면 St. 3을 제외하고 모든 지역에서 80%를 넘어 우점하는 것으로 나타났다. St. 3의 경우 > 300 μm의 미세플라스틱이 38.1%, > 500 μm의 미세플라스틱이 25.6%를 차지하는 것으로 나타나 비교적 큰 미세플라스틱이 많이 분포하는 것으로 나타났다.
고 찰
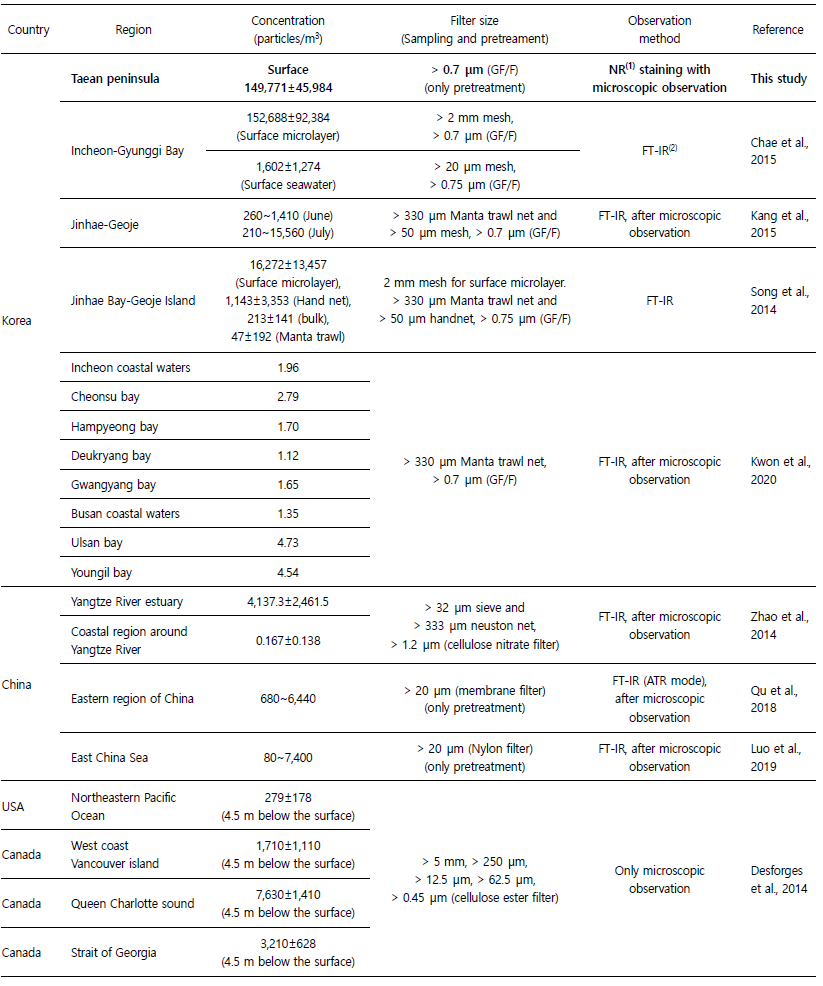
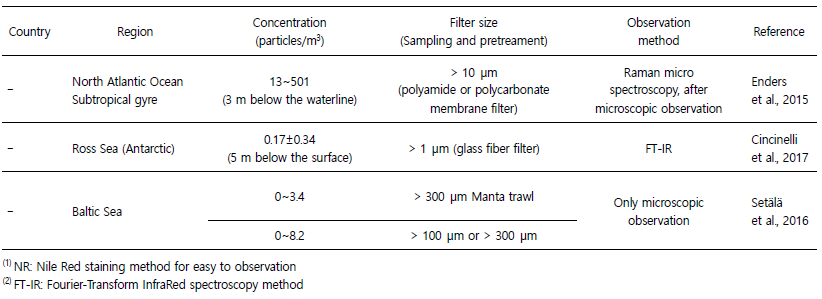
육지에서 생산된 플라스틱은 강과 하천을 통해 해양환경으로 80~94% 수송되며(Jambeck et al., 2015; Schmidt et al., 2017Schmidt et al., 2017), 해양환경 내에서 플라스틱은 다양한 풍화과정을 통해 2차 미세플라스틱으로 파편화 될 수 있다(Corcoran et al., 2009). 특히 연안환경은 자외선, 산소, 기계적 힘 및 고온 등에 의해 좋은 자연 풍화 조건을 제공하여 미세플라스틱의 오염에 대해 더욱 우려해야 하는 상황이다(Andrady, 2011; Song et al., 2017). 본 연구를 통해 확인된 태안반도 인근 표층 해수 내 미세플라스틱의 정량분포는 전체평균 149,771 ± 45,984 particles/m3로 나타났다. 시기와 장소는 다르지만 국내 연안 해수 내 미세플라스틱 분포 연구결과 210~211,000 particles/m3로 나타났으며, 중국의 경우 0.167~ 6,440 particles/m3, 미국 북동태평양의 경우 279 ± 178 particles/ m3, 캐나다 1,710~7,630 particles/m3, 북대서양 아열대 환류 13~ 501 particles/m3, 로스해(남극) 0~0.51 particles/m3, 발트해 0~8.2 particles/m3로 보고된 바 있으나(Table 3), 크게 해수 샘플링 방식, 전처리 방식, 측정방식에 따른 실험 오류, 자세하게는 필터 종류, 밀도분리 방법의 차이 등 다양한 방법론적 차이로 인하여 때문에 각각의 연구결과를 직접적으로 비교하여 지역별 미세플라스틱의 농도의 높고 낮음을 이야기하기는 힘들다. 예를 들어 각 연구에서 사용한 해수시료의 획득위치(eg. Surface microlayer, Surface seawater, 4.5 m below the waterline, 5 m below the surface) 혹은 획득방식(eg. Manta trawl net, hand net, bulk)에 따라 동일한 전처리 방식을 사용하거나 관측방식을 사용하더라도 표본에서의 미세플라스틱 정량분석결과에 직접적인 영향을 줄 수 있다. 실제로 Song et al., 2014; Chae et al., 2015의 연구에 따르면 동일 지역에서 다른 방식으로 샘플링 된 해수는 미세플라스틱 정량분석결과의 차이가 나타난다는 결과가 보고된 바 있다. 또한 본 연구의 결과와 같이 해수 내에서 미세플라스틱은 사이즈가 작을수록 대다수를 차지하기 때문에(Fig. 3B), 사용하는 filter의 종류나 pore size는 전처리 과정에서 소실과 획득되는 미세플라스틱 양에 직접적인 영향을 미친다. 본 연구에서 사용한 filter는 GF/F 필터로 0.7 μm 이상의 미세플라스틱은 모두 관찰이 가능하지만, 일부 연구에 의하면 > 300 μm의 필터링을 통해 전처리를 수행한 뒤 분석한 결과도 존재하며 이 경우 상대적으로 낮은 미세플라스틱의 분포를 나타낸 바 있다(Setälä et al., 2016).
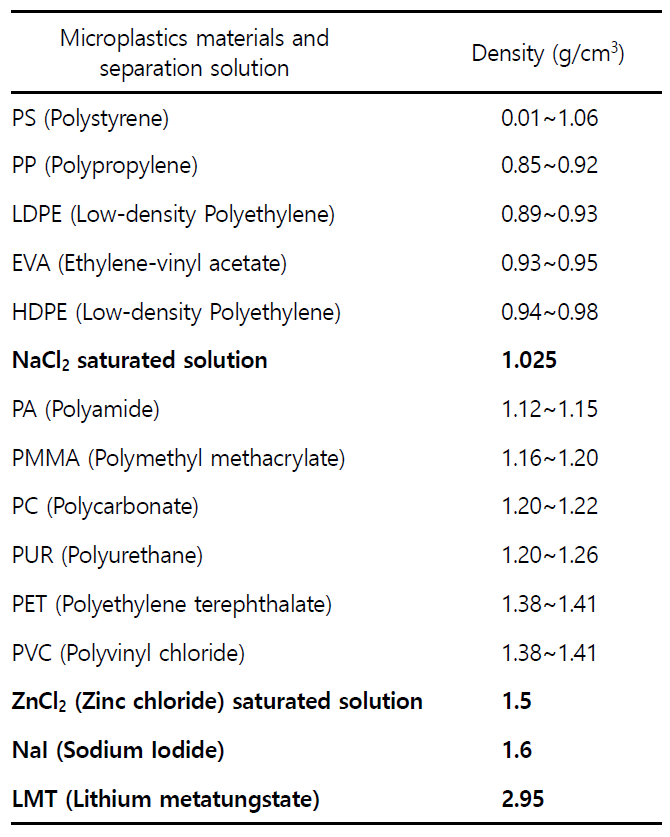
또한 본 연구에서는 전처리 과정에서 밀도가 1.025 g/cm3인 NaCl2 포화용액을 밀도분리를 위하여 사용하였다. NaCl2 포화용액의 경우 저렴하고 구하기 쉬우며 쉽고 다루기 쉬워 널리 사용이 가능하지만, 밀도가 1.025 g/cm3보다 큰 PA, PMMA, PC, PUR, PET, PVC의 경우(Table 2), 전처리 과정에서 소실될 수 있어 실제 미세플라스틱 정량값에 비하여 과소평가 될 수 있다는 한계가 존재한다. 이에 전처리 과정 중 밀도분리 과정에서 ZnCl2 포화용액, NaI, LMT를 사용한다면 밀도가 비교적 높은 미세플라스틱을 포함하여 더욱 해양환경 내 미세플라스틱의 정확한 정량수치를 확인할 수 있을 것이다.
전처리 방법 외에도, 지금까지 알려져 있는 다양한 미세플라스틱 관측방법에는 크게 FT-IR microscope (Manual mode, Tracking mode, Array detector), Raman spectroscopy, 그리고 본 연구에서 사용한 형광 염색을 통한 분석방법이 있다. FT-IR microscope, Raman spectroscopy 방법은 정성분석이 가능하여 실험 오류의 가능성이 낮으며, 대용량의 처리분석이 가능하고 자동화된 데이터 수집이 가능하다. 하지만 고가의 장비와 스펙트럼 분석에 전문 인력이 필요하며 분석에 오랜 시간이 필요하다(Shim et al., 2017; Cho et al., 2019; Choi, 2021; Choi et al., 2022). 하지만 본 연구에서 사용한 형광분석 방법의 경우 정성분석이 불가능하기에 전처리 과정에서 처리된 일부 유기물도 카운팅 되어 정량분석 결과가 과대평가 될 우려가 있다(Shim et al., 2016). 하지만 쉽고, 분석 가격이 저렴하며 신속한 분석이 가능하여 다수의 샘플에 대한 정량 스크리닝을 위한 적용에 적합할 수 있다. 이처럼 현재는 전처리 과정을 포함하여 미세플라스틱 정량 · 정성을 위하여 다양한 방법이 존재하므로, 각 방법의 장단점을 확인하고 해수 내 미세플라스틱 분석에 적합한 방법을 선정하는 작업을 통해 표준안의 확립이 필요한 상황이다.
지역적으로 미세플라스틱 검출량의 차이가 나타나는 원인을 파악하기 위하여 채집지역별 위치, 저질의 종류, 검출되는 플라스틱 크기와의 비교를 수행하였다. 지역별 미세플라스틱 검출량의 경우 St. 2, St. 4, St, 6, St. 8 같이 지역적으로 내만에 위치한 지점이 상대적으로 많을 것으로 예상하였으나, 연구결과 내만에 위치하는 것은 미세플라스틱 검출량과 직접적인 상관관계를 가지지 않는 것으로 나타났다. 또한 Table 1에 표기되어있는 채집지역별 저질의 종류(암석, 자갈, 모래, 실트, 머드)와도 직접적인 상관관계를 나타내지 않는 것으로 나타났다. 이는 연안환경 중 퇴적물의 입도와 미세플라스틱의 농도는 상관관계가 없는 것으로 사료된다. 그럼에도 불구하고 지역 별로 검출된 미세플라스틱의 크기를 살펴보면 < 300 μm 이하의 미세플라스틱은 St. 1, St. 2, St. 4, St. 5, St. 6, St. 7, St. 8에서 80% 이상을 차지하고 있지만 St. 3의 경우 > 300 μm 이상의 미세플라스틱이 38.1%를 차지하며 특히 > 1,000 μm 이상의 미세플라스틱이 20.3%를 차지하여 지역 별로 우점하는 미세플라스틱의 크기가 다르다는 것을 확인 할 수 있었다(Fig. 4.)
본 연구에서는 미세플라스틱의 농도, 크기별 검출량과 샘플링 지점의 특성(위치, 저질의 종류)과 같은 다양한 접근에도 불구하고 뚜렷한 상관관계를 확인 할 수 없었다. 이는 태안반도의 경우 2개 주요하천인 삽교천, 안성천과, 9개 지방하천인 어은천, 흥인천, 장검천, 용요천, 삭석천, 화수천, 청지천, 도당천, 석림천이 위치하여 육상에서부터의 유입에 의한 간섭이 존재하며, 어업과 양식업이 매우 발달한 지역으로 어업과 양식업에 따른 미세플라스틱 발생을 예측하기 어렵다. 또한 태안반도는 해안선이 복잡한 리아스식 해안으로 구성되어있어 지리적으로 미세플라스틱의 분포와 이동을 예측의 어려움이 가중될 수 있다. Choi, 2021는 다음과 같은 요인이 해수 내에서 미세플라스틱의 이동에 영향을 준다고 보고했다. 첫째, 플라스틱의 재질에 따른 물리 화학적 특성, 둘째, 해양의 동적 조건(해류, 바람, 파도, 조류 등), 셋째, 지질학적 특성(지형, 경사 등), 넷째, 연안 생물을 포함한 저질의 구성 및 특성, 다섯째, 생물과의 상호작용, 여섯째, 인간활동(어업, 개발, 관광 등), 일곱째, 홍수나 강우(Barnes et al., 2009; Zhang, 2017; Alimi et al., 2018; Han, 2020; Peng et al., 2020; Horton et al., 2017; Alimi et al., 2018). 이와 같이 다양한 요인이 복합적으로 상호작용하는 해양환경 내에서 미세플라스틱의 지역별 모니터링 및 스크리닝을 진행할 때는 샘플링 위치에 대한 다양한 기초 정보의 조사가 필요할 것이다.
그럼에도 본 연구뿐만 아니라 다양한 연구결과를 통하여 한국의 서남 해안의 연안과 하구지역이 전 세계에서 2, 3번째로 높게 나타나 미세플라스틱의 핵심 우려지역인 것으로 알려져 있으며(Hurley et al., 2018), 한국 해안과 해변 침전물의 미세플라스틱 검출량도 전 세계적으로 상위권으로 기록된 바 있어(Kang et al., 2015; Sim et al., 2018), 서해 연안지역의 미세플라스틱 농도는 지속적으로 관심을 가지고 모니터링이 필요한 상황이다. 본 연구에서 채택한 시험방법은 다른 연구와 직접적으로 비교할 수 없으며, 미세플라스틱 농도가 과대평가될 수 있다는 단점이 존재한다. 그럼에도 미세플라스틱 정량 스크리닝 분석을 통해 St. 1, 5, 8과 같이 미세플라스틱 농도가 상대적으로 높게 나타난 지역에 대하여, 추후 해수, 생산단계 수산물 등에서의 미세플라스틱 중점 모니터링을 지속적으로 수행하고 결과를 축적하여 국가적 측면에서의 미세플라스틱 수산물 안전을 모색할 필요가 있다는 기초를 제공할 수 있다. 그 외에도 미세플라스틱의 정량분석에 대한 정확한 판단이 가능하도록 다양한 시험법의 장점을 비교하여 고도화하는 연구가 필요하고, 연안환경의 복합요인에 대한 영향을 확인하고 분석과정에서 다양한 변인에 대한 통제가 가능할 정도로 충분한 데이터의 축적이 필요하며, 지금까지 다양한 연구결과의 방식과 결과를 하나로 모으고 자체 분석의 수행이 가능한 DB의 구축이 필요할 것이다.
- References
-
1. Alimi OS, Budarz JF, Hernandez LM, Tufenkji N. 2018. Microplastics and Nanoplastics in Aquatic Environments: Aggregation, Deposition, and Enhanced Contaminant Transport. Environ Sci Technol 52: 1704-1724.
-
-
3. Arthur C, Baker J, Bamford H. 2009. Proceedings of the International Research Workshop on the Occurrence, Effects, and Fate of Microplastic, Marine Debris. Group 530.
-
4. Auta HS, Emenike CU, Fauziah SH. 2017. Distribution and import- ance of microplastics in the marine environmentA review of the sources, fate, effects, and potential solutions. Environ Int 102: 165-176.
-
5. Barnes DKA, Galgani F, Thompson RC, Barlaz M, Barnes DKA, Galgani F, Thompson RC, Barlaz M. 2009. Accumulation and Fragmentation of Plastic Debris in Global Environments Linked references are available on JSTOR for this article: Accumulation and fragmentation of plastic debris in global environments. Philos Trans R Soc B Biol Sci 364: 1985-1998.
-
6. Browne MA, Dissanayake A, Galloway TS, Lowe DM, Thompson RC. 2008. Ingested microscopic plastic translocates to the circulatory system of the Mussel, Mytilus edulis (L.). Environ Sci Technol 42: 5026-5031.
-
7. Chae DH, Kim IS, Kim SK, Song YK, Shim WJ. 2015. Abundance and distribution characteristics of microplastics in surface seawaters of the Incheon/Kyeonggi coastal region. Arch Environ Contam Toxicol 69: 269-278.
-
8. Cho SA, Cho WB, Kim SB, Chung JH, Kim HJ. 2019. Identification of microplastics in sea salts by Raman microscopy and FT-IR microscopy. Anal Sci Technol 32: 243-251.
-
9. Choi H. 2021. Investigation of Microplastic in the Maricultural Organisms: Abundance, Absorption, Egestion, and Toxicity, Ph.D dissertation, Incheon National University.
-
10. Choi H, Im DH, Park YH, Lee JW, Yoon SJ, Hwang UK. 2022. Ingestion and egestion of polystyrene microplastic frag- ments by the Pacific oyster, Crassostrea gigas. Environmental Pollution 246: 174-182.
-
11. Cincinelli A, Scopetani C, Chelazzi D, Lombardini E, Martellini T, Katsoyiannis A, Fossi MC, Corsolini S. 2017. Microplastic in the surface waters of the Ross Sea (Antarctica): occurrence, distribution and characterization by FTIR. Chemosphere 175: 391-400.
-
12. Cole M, Lindeque P, Halsband C, Galloway TS. 2011. Microplastics as contaminants in the marine environment: A review. Mar Pollut Bull 62: 2588-2597.
-
13. Corcoran P, Mark L, Biesinger C, Meriem G. 2009. Plastics and beaches: a degrading relationship. Mar Pollut Bull 58: 80-84.
-
14. Desforges JPW, Galbraith M, Dangerfield N, Ross PS. 2014. Wide- spread distribution of microplastics in subsurface seawater in the NE Pacific Ocean. Mar Pollut Bull 79: 94-99.
-
15. Dong Y, Gao M, Song Z, Qiu W. 2020. As(III) adsorption onto different-sized polystyrene microplastic particles and its mechanism. Chemosphere 239: 124792.
-
16. Enders K, Lenz R, Stedmon CA, Nielsen TG. 2015. Abundance, size and polymer composition of marine microplastics ≥10 μm in the Atlantic Ocean and their modelled vertical distribution. Mar Pollut Bull 100: 70-81.
-
17. Gallagher A, Rees A, Rowe R, Stevens J, Wright P. 2016. Micro- plastics in the Solent estuarine complex, UK: An initial assess- ment. Mar Pollut Bull 102: 243-249.
-
18. Gardon T, Reisser C, Soyez C, Quillien V, Le Moullac G. 2018. Microplastics Affect Energy Balance and Gametogenesis in the Pearl Oyster Pinctada margaritifera. Environ Sci Technol 52: 5277-5286.
-
19. Guo X, Pang J, Chen S, Jia H. 2018. Sorption properties of tylosin on four different microplastics. Chemosphere 209: 240-245.
-
20. Han SK. 2020. The Concept of Microplastics and their Occurrence, Transport, Biological Effects, and Management Methods in the Ocean. J Environ Health Sci 46: 610-626.
-
21. Hantoro I, Löhr AJ, Van Belleghem FGAJ, Widianarko B, Ragas AMJ. 2019. Microplastics in coastal areas and seafood: implications for food safety. Food Addit. Contam. - Part A Chem. Anal Control Expo Risk Assess 36: 674-711.
-
22. Horton AA, Walton A, Spurgeon DJ, Lahive E, Svendsen C. 2017. Microplastics in freshwater and terrestrial environments: Evaluating the current understanding to identify the know- ledge gaps and future research priorities. Sci Total Environ 586: 127-141.
-
23. Huerta Lwanga E, Thapa B, Yang X, Gertsen H, Salánki T, Geissen V, Garbeva P. 2018. Decay of low-density polyethylene by bacteria extracted from earthworm's guts: A potential for soil restoration. Sci Total Environ 624: 753-757.
-
24. Hurley R, Woodward J, Rothwell JJ. 2018. Microplastic contam- ination of river beds significantly reduced by catchment-wide flooding. Nat Geosci 11: 251-257.
-
25. Jambeck JR, Ji Q, Zhang YG, Liu D, Grossnickle DM, Luo ZX. 2015. Plastic waste inputs from land into the ocean. Science 347: 764-768.
-
26. Jang DH, Kim CS, Park JH. 2010. The Land-cover Changes and Pattern Analysis in the Tidal Flats Using Postclassification Comparison Method: The Case of Taean Peninsula. Journal of the Korean Geographical Society 45: 275-292.
-
27. Jeong GS, Cha BY, Im YJ, Kwon DH, Hwang HJ, Jo HS. 2014. Comparison of Species Composition and Seasonal Variation of Demersal Organisms Caught by Otter Trawl in the Coastal Waters off the Taean Peninsula, in the West Sea of Korea. Kor J Fish Aquat Sci 47: 264-273.
-
28. Kang JH, Kwon OY, Lee KW, Song YK, Shim WJ. 2015. Marine neustonic microplastics around the southeastern coast of Korea. Mar Pollut Bull 96: 304-312.
-
29. Koelmans AA, Gouin T, Thompson R, Wallace N, Arthur C. 2014. Plastics in the marine environment. Environ Toxicol Chem 33: 5-10.
-
30. Kwon OY, Kang J-H, Hong SH, Shim WJ. 2020. Spatial distribution of microplastic in the surface waters along the coast of Korea. Mar Pollut Bull 155: 110729.
-
31. Luo W, Su L, Craig NJ, Du F, Wu C, Shi H. 2019. Comparison of microplastic pollution in different water bodies from urban creeks to coastal waters. Environmental Pollution 246: 174-182.
-
32. Lusher A. 2015. Microplastics in the marine environment: distri- bution, interactions and effects. Marine anthropogenic litter. Springer Cham 245-307.
-
33. Mathalon A, Hill P. 2014. Microplastic fibers in the intertidal eco- system surrounding Halifax Harbor, Nova Scotia. Mar Pollut Bull 81: 69-79.
-
34. Mendoza LMR, Balcer M. 2019. Microplastics in freshwater environ- ments: a review of quantification assessment. Trends Analyt Chem 113: 402-408.
-
35. Ng EL, Huerta Lwanga E, Eldridge SM, Johnston P, Hu HW, Geissen V, Chen D. 2018. An overview of microplastic and nanoplastic pollution in agroecosystems. Sci Total Environ 627: 1377-1388.
-
36. Ng KL, Obbard JP. 2006. Prevalence of microplastics in Singapore's coastal marine environment. Mar Pollut Bull 52: 761-767.
-
37. Park BM, Kim MJ, Jeong YG, Park JI, Yu HS, Oh EG. 2021. Antimicrobial Resistance Characteristics of Gram-Negative Bacteria Isolated from Inland Pollution Sources in the Drain- age Basin of Iwonmyeon (Taean-gun), South Korea. Korean J Fish Aquat Sci 54: 377-387.
-
38. Peng L, Fu D, Qi H, Lan CQ, Yu H, Ge C. 2020. Micro- and nano-plastics in marine environment: Source, distribution and threats — A review. Sci Total Environ 698: 134254.
-
39. Plastics Europe. 2019. Plastics the Facts 2019; an Analysis of European Plastics Production, Demand and Waste Data. Retrieved from. https://www.plasticseurope.org/application/ files/9715/7129/9584/FINAL_web_version_Plastics_the_facts2019_14102019.pdf.
-
40. Qu X, Su L, Li H, Liang M, Shi H. 2018. Assessing the relationship between the abundance and properties of microplastics in water and in Mussels. Sci Total Environ 621: 679-686.
-
41. Schmidt C, Krauth T, Wagner S. 2017. Export of Plastic Debris by Rivers into the Sea. Environ Sci Technol 51: 12246-12253.
-
42. Setälä O, Magnusson K, Lehtiniemi M, Norén F. 2016. Distribution and abundance of surface water microlitter in the Baltic Sea: a comparison of two sampling methods. Mar Pollut Bull 110: 177-183.
-
43. Shim WJ, Thompson RC. 2015. Microplastics in the ocean. Arch Environ Contam Toxicol 69: 265-268.
-
44. Shim WJ, Song YK, Hong SH, Jang M. 2016. Identification and quantification of microplastics using Nile Red staining. Mar Pollut Bull 113: 469-476.
-
45. Shim WJ, Hong SH, Eo SE. 2017. Identification methods in micro- plastic analysis: A review. Anal Methods 9: 1384-1391.
-
46. Shim WJ, Hong SH, Eo SE. 2018. Marine microplastics: Abundance, distribution, and composition, Microplastic Contamination in Aquatic Environments: An Emerging Matter of Environmental Urgency.
-
47. Song YK, Hong SH, Jang M, Kang JH, Kwon OY, Han GM, Shim WJ. 2014. Large accumulation of micro-sized synthetic polymer particles in the sea surface microlayer. Environ Sci Technol 48: 9014-9021.
-
48. Song YK, Hong SH, Jang M, Han GM, Jung SW, Shim WJ. 2017. Combined effects of UV exposure duration and mechanical abrasion on microplastic fragmentation by polymer type. Environ Sci Technol 51: 4368-4376.
-
49. Stolte A, Forster S, Gerdts G, Schubert H. 2015. Microplastic con- centrations in beach sediments along the German Baltic coast. Mar Pollut Bull 99: 216-229.
-
50. Thompson RC, Olson Y, Mitchell RP, Davis A, Rowland SJ, John AWG, McGonigle D, Russell AE. 2004. Lost at Sea: Where Is All the Plastic? Science 304: 838.
-
51. Wang J, Tan Z, Peng J, Qiu Q, Li M. 2016. The behaviors of micro- plastics in the marine environment. Mar Environ Res 113: 7-17.
-
-
53. Zhao S, Zhu L, Wang T, Li D. 2014. Suspended microplastics in the surface water of the Yangtze Estuary System, China: first observations on occurrence, distribution. Mar Pollut Bull 86: 562-568.
Copyright (C) 2024. The Korean Society of Marine Life Science