


JMLS 2022 June;7(1):1-9. 10.23005/ksmls.2022.7.1.1 Epub 2022 June 17
Copyright © 2022 by The Korean Society of Marine Life Science
Effect of Starving and Re-feeding on Appetite-related Genes in Olive Flounder Paralichthys olivaceus
Min Ju Kim; Department of Convergence Study on the Ocean Science and Technology, Korea Maritime and Ocean University, Busan 49112, Korea
Jin Ah Song; Marine Bio-Resources research Unit, Korea Institute of Ocean Science and Technology, Busan 49111, Korea
Cheol Young Choi; Department of Convergence Study on the Ocean Science and Technology, Korea Maritime and Ocean University, Busan 49112, Korea; Division of Marine BioScience, Korea Maritime and Ocean University, Busan 49112, Korea
- Abstract
This investigation aimed to assess the appetite response changes of olive flounder to starving and re-feeding conditions. Three different feeding groups (2 weeks feeding, fed; 2 weeks starving, starved; and 1 week starving and 1 week feeding, re-fed) were established to examine the changes in appetite-related genes for each group. The weight gain of the fish was highest for the fed group and lowest for the starving group. Based on the daily feed intake (DFI) and cumulative feed intake (CFI), overall food intake was found to increase in the re-fed group more than in the fed group from week 1 to week 2 of the experiment. Hypocretin neuropeptide precursor (HCRT) and galanin receptor 1 (GAL-R1) mRNA expression in the brain of olive flounder were decreased in the starved group. Corticotropin-releasing hormone (CRH) was decreased in all experimental groups, except for the fed group. However, overall leptin concentrations in the plasma did not change across groups. Considering the differences between this study and previous studies on starving and feeding, various factors (except the production and expression mechanisms of appetite-related factors in response to starving) are likely acting on the appetite responses of the fish. In this study, a 1-week re-feeding period induced substantial effects on appetite response when compared to a 2-week feeding period. These findings show that even if re-feeding is performed after starving, the unbalance caused by the re-feeding can affect various physiological changes in fish by feed intake efficiency.
Keywords: Appetite Corticotropin-releasing hormone Hypocretin neuropeptide precursor Olive flounder Re-feeding
Correspondence to: Cheol Young Choi; Division of Marine BioScience, Korea Maritime and Ocean University, Busan 49112, Korea; E-mail: choic@kmou.ac.kr
- Received
- 6 April 2022;
- Revised
- 6 April 2022;
- Accepted
- 14 April 2022.
This is an Open Access article distributed under the terms of the Creative Commons Attribution Non-Commercial License (http://creativecommons.org/licenses/by-nc/3.0/) which permits unrestricted non-commercial use, distribution, and reproduction in any medium, provided the original work is properly cited.
Language: English,
Full Text:

Introduction
Fasting in fish is caused by various natural environmental factors, such as seasonal changes and loss of food resources, as well as by behavioral and state factors such as the spawning and rearing of fish, habitat movement, and transport (Navarro and Gutierrez, 1995; McCue, 2010). The fasting of fish can be caused by natural or artificial feeding restrictions, which can last from a few days to several weeks. Fish can survive fasting due to metabolic controls that activate when there is no food intake for a certain period of time (Ali et al., 2003). Based on food intake, various physiological reactions efficiently convert nutrients in the bodies of fish (Bar, 2014); simultaneously, genes related to food intake and appetite are also altered (Choi et al., 2021). These physiological changes can be induced by fish appetite-related factors and signals and are known to be regulated by complex interactions in the central nervous system and peripheral nervous system of fish (Volkoff et al., 2005). Previous studies have shown that the hypothalamic region is involved in regulating food intake (Williams et al., 2001). In addition, appetite-regulating responses have been confirmed to occur in response to changes in the expression of appetite-related peptides in the central nervous system including the hypothalamus, as well as in peripheral organs such as the gastrointestinal tract, pancreas, liver, and adipose tissue (Volkoff et al., 2009). The appetite-related peptides of fish include HCRT (hypocretin; orexin precursor), galanin (GAL), corticotropin-releasing hormone (CRH), leptin, ghrelin, neuropeptide Y, and melanin-concentrating hormone (Volkoff et al., 2005). These factors are involved in transmitting signals related to appetite control and satiety through the central and peripheral nervous systems, depending on their location of expression or action. HCRT and GAL are expressed in the hypothalamus and act as regulators to promote appetite (Volkoff et al., 2009; Butler et al., 2020). HCRT increases food intake and induces food-seeking behavior (Barson and Leibowitz, 2017). The activation of GAL neurons in the paraventricular nucleus (PVN) in the pituitary gland promotes food intake, increases body weight, and simultaneously inhibits gastric emptying (Holzer-Petsche and Moser, 1993). Intracerebroventricular (ICV) injection of HCRT and GAL to goldfish, Carassius auratus, was shown to promote food intake (Pedro et al., 1995; Volkoff et al., 1999). In zebrafish, Danio rerio, fasting has been shown to increase the expression of GAL receptor (GAL-R1a) mRNA in intestinal tissues, whereas its ex- pression is decreased after re-feeding (Li et al., 2013). Moreover, GAL-R1 is more abundant than GAL-R2 in the brains of rats (O'Donnell et al., 1999) and is known to stimulate high-fat intake (Erhuma et al., 2007; Zorrilla et al., 2007). However, CRH and leptin act as appetite suppressant regulators, unlike HCRT and GAL-R1. In fish, CRH is a potent appetite suppressant acting on the hypo- thalamus (Bernier and Peter, 2001; Crespi et al., 2004). An increase in CRH reduces appetite and food intake (Bernier, 2006), and leptin also acts to reduce appetite by inhibiting the activity and stimulation of anorectic neurons (Chu et al., 2010). Leptin is pro- duced in adipose tissue and exists in a form that circulates through the bloodstream and acts on the central nervous system (Ahima et al., 2000). Leptin has been reported to reduce food intake in fish (Stanley et al., 2005; Wynne et al., 2005). The olive flounder Paralichthys olivaceus is a major fish species widely cultivated in Asia and is commercially important in Korea. Studies on olive flounder regarding its compensatory growth (Cho et al., 2006) and stress induced by starvation (Choi et al., 2018) are ongoing, and few studies have examined the effects of starving on fish appetite and food intake-related regulators. Therefore, in this study, we aimed to investigate the effects of starving on appetite control factors at the molecular level by determining the expression of HCRT, GAL-R1, and CRH mRNA and the changes in plasma leptin concentrations, which are known factors that control appetite by acting on the central nervous system of fish, using 1 and 2 week starvation periods and a 1 week re-feeding process in olive flounder.
Materials and Methods
1. Experimental fish
Juvenile olive flounders (total length, 10.5 ± 0.4 cm; body weight, 9.2 ± 0.5 g) were purchased from a fish farm in Pohang, Korea, and allowed to acclimate for 2 weeks in 24 circulation filter tanks (49 × 49 × 49 cm, 118 ℓ). The fish were maintained at 20 ± 1.1℃, under 30 psu (practical salinity units), with a 12-h light:dark photoperiod (light from 07:00~19:00), and dissolved oxygen (10 ml/ℓ). Fish were fed twice daily at 09:00 and 17:00 with floating commercial feed (KOFEC Feed, Jeonnam, South Korea; 52% crude protein, 10% crude lipid) for olive flounders.
2. Fasting and feeding experimental conditions
During the experiment, the olive flounders were divided into 3 different feeding groups designated as follows: fed, starved, and re-fed. The fed experimental group (control) was fed continuously for 2 weeks, and the starved group was maintained in a starving state without feeding for 2 weeks as a negative control. Re-fed groups were fasted for 1 week, and then re-fed with food for 1 week. All feeding treatment groups were irradiated under a white fluorescent bulb (wavelength 350~650 nm, 0.96 W/m2 intensity; Philips, The Netherlands), and the light sources were placed 40 cm above the surface of the water. Sampling was per- formed at 15:00 every week for 2 weeks from the start of the experiment for each group. Before sampling, the fish were weighed to obtain initial and final weight values. To minimize the stress to the olive flounder when performing sampling, the fish were anes- thetized with 200 μg/ℓ of 2-phenoxyethanol (Sigma, USA) prior to blood collection and brain tissue sampling. Plasma samples were separated by centrifugation (4℃, 1,000 × g for 15 min) from the collected blood and stored at -80℃ until further analysis.
3. Survival rate and weight gain
The survival rate was determined by comparing the number of animals at the start of the experiment with the number of animals after 2 weeks. Weights were measured at 2 weeks and calculated using the following formula: Weight gain (g/fish) = body weight at final day - body weight at initial day.
4. Food intake
Food intake was calculated using the following standard formula: daily feed intake (DFI, %) = 100 × feed intake/average body weight at initial and final days. The consumed amounts of feed were recorded every week and the cumulative feed intake (CFI, g) was calculated.
5. Total RNA extraction and cDNA synthesis
Total RNA was extracted from each sample using the TRI Reagent® (Molecular Research Center, Inc., Cincinnati, OH, USA), according to the manufacturer's instructions. The concentration and purity of the RNA samples were then measured at 260 nm and 280 nm using a spectrophotometer (BioDrop, Cambridge, UK). Then, 2 μg of total RNA was reverse transcribed in a total reaction volume of 20 μl, using an oligo-(dT)15 anchor and M-MLV reverse transcriptase (Promega, Madison, WI, USA), according to the manu- facturer's protocol. The synthesized cDNA was stored in a refrig- erator at 4℃ until used for real-time quantitative polymerase chain reaction (qPCR) analysis.
6. Real-time quantitative polymerase chain reaction (qPCR) analysis
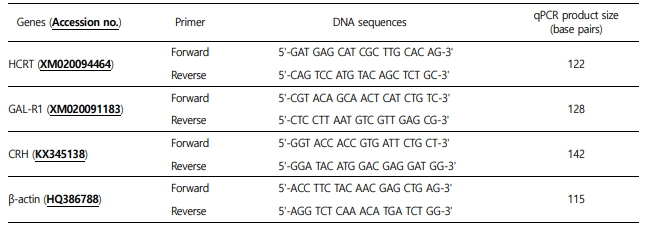
The qPCR analysis was conducted to determine the relative expression levels of HCRT, GAL-R1, and CRH using cDNA reverse transcribed from total RNA extracted from the brain of juvenile olive flounders. The sequences of the qPCR primers used in the experiment are shown in Table 2. We conducted qPCR amplifi- cation using a Bio-Rad CFX96 real-time PCR detection system (Bio-Rad, Hercules, CA, USA), and the iQ SYBR green Supermix (Bio-Rad, USA), following the manufacturer's instructions. A 25-μl reaction volume containing 0.5 μl of cDNA, 0.26 μM of each primer, 0.2 mM dNTP, SYBR Green, Taq polymerase, and buffer (10 mM Tris-HCl [pH 9.0], 50 mM KCl, 1.4 mM MgCl2, and 20 nM fluorescein) was prepared. The qPCR process was performed under the following conditions: one cycle of initial denaturation at 95℃ for 5 min, 35 cycles of denaturation at 95℃ for 20s and annealing at 55℃ for 20s, followed by 5 min at 72℃ for the final extension. Duplicates of each sample were analyzed in the same test. All data are expressed as the difference from the corresponding calculated β-actin threshold cycle (Ct) levels. Relative mRNA expression levels were determined using the 2-ΔΔCt method (Livak and Schmittgen, 2001).
7. Plasma parameter analysis
Plasma was centrifuged at 4℃ and 1,000 × g for 15 minutes to remove the supernatant, and the remaining pellet was used for analysis. The concentration of the plasma leptin levels was determined using a Leptin ELISA kit (MBS1601696, MyBioSource, San Diego, CA, USA) according to the manufacturer's instructions.
8. Statistical analysis
All data were analyzed using the SPSS statistical package (version 25.0; SPSS, Inc., USA). For multiple comparison tests, significant differences (p < 0.05) between the data were compared using one-way ANOVA followed by Tukey's post-hoc test. Values are expressed as the mean ± standard error (SE).
Results
1. Weight gain and changes in feed intake
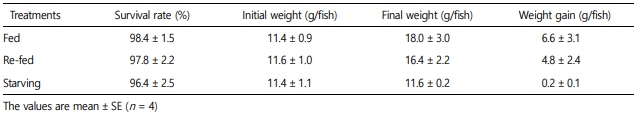
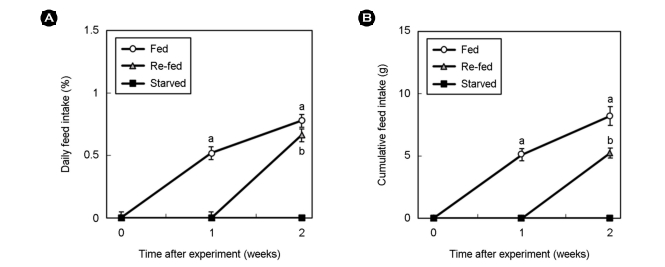
Weight gain was determined for each experimental group for the 2 weeks the experiment was conducted (Table 1). Weight gain was highest in the order of fed (6.6 ± 3.1), re-fed (4.8 ± 2.4), and starved (0.2 ± 0.1) (p < 0.05). The DFI and CFI for the starved and re-fed groups were calculated for each experimental group (Fig. 1). In all experimental groups except for the starved group, DFI increased with time. In addition, when comparing the degree of increase in feed intake from the 1st week to the 2nd week, the degree of increase in the re-fed group was found to have increased more quickly than in the fed group when re-feeding began. The CFI also tended to increase in all experimental groups except for the starved group over time.
2. Changes in HCRT expression
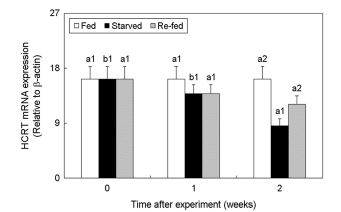
We analyzed the effect of fasting and re-feeding on the changes in the HCRT mRNA expression levels in the brain of the olive flounder (Fig. 2). No significant difference was observed in the expression of the HCRT mRNA between the fed and re-fed groups, whereas its expression was significantly decreased with time in the starved group.
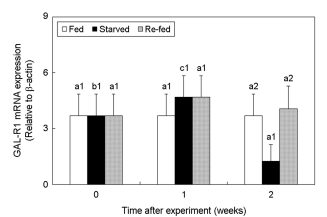
3. Changes in GAL-R1 expression
The effects of fasting and re-feeding on the expression changes of GAL-R1 mRNA in the brain of the olive flounder were assessed (Fig. 3). There was no significant difference observed in the ex- pression level of the GAL-R1 mRNA between the fed group) and the re-fed group. However, the starved group showed significantly decreased expression of GAL-R1 mRNA at 2 weeks (starved at 2 weeks; 1.24 ± 0.90, p < 0.05).
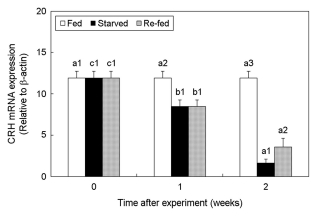
4. Changes in CRH expression
The effect of fasting and re-feeding on the changes in the CRH mRNA expression in the brain of the olive flounder was examined (Fig. 4). One week from the start of the experiment, the expression level of the CRH mRNA decreased in the starved group compared to the fed group. In the starved group, CHR mRNA expression decreased dramatically compared to the re-fed group. In addition, as the starving time increased, CRH expression decreased significantly. However, CRH expression increased significantly with re-feeding (starved at 2 weeks; 1.61 ± 0.48, re-fed at 2 weeks; 3.55 ± 1.07, p < 0.05).
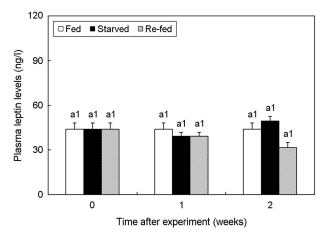
5. Changes in the plasma leptin concentration
Analysis of the effects of starving and re-feeding on the changes in plasma leptin concentrations in the olive flounder (Fig. 5) showed no significant differences between the starving and re-feeding groups throughout the experimental period (p > 0.05).
Discussion
In this study, we investigated the endocrinological changes induced in the expression of appetite regulator-related peptides by rearing olive flounder in three different feeding groups (fed, starved, and re-fed) for 2 weeks. The fed group had the greatest increases in weight overall. Moreover, when compared to the fed group, the starved group showed smaller changes in weight gain as they could not intake food. There was also a change in weight gain in the re-fed group, but only a small change in weight gain was observed compared to the fed group. Analysis of the changes in the amount of feeding between the starved and re-fed treatments revealed that the DFI at the 2nd week was higher in the re-fed group compared to the fed group. Thus, food intake increased as the body required more energy, as the olive flounder did not eat during the starvation period. Similarly, according to a study by Cho (2014), a compensatory growth effect was observed in olive flounder when fed for 7 weeks after 1 week of fasting. Additionally, Wu et al. (2002) reported that, in Chinese longsnout catfish Tachysurus dumerili, food intake increased after 1 week of fasting rather than with continuous feeding. This study also showed a tendency towards increased food intake with fasting, indicating that 1 week of fasting can promote the food intake response in olive flounder.
HCRT and GAL-R1 act as appetite-stimulating regulators. We found that HCRT mRNA expression decreased in the starved group compared to the fed group. However, Novak et al. (2005) reported that HCRT expression was increased during fasting in adult zebrafish Danio rerio. In this study, the decreased HCRT ex- pression with starvation seems to reflect the effect of starvation on the development of the HCRT expression system components during the juvenile period. Iwasa et al. (2015) reported that hypo- thalamic OX2R (Orexin receptor 2) mRNA expression was de- creased by starving in infant rats (10 days postpartum). This is an interesting result considering that HCRT is a precursor of orexin. Thus, starving likely acted as a factor in the decrease of HCRT expression in relation to the developing HCRT expression pathway in juvenile fish. Moreover, the physiological and behavioral changes in the fish due to starvation may differ depending on the degree of HCRT expression pathway development.
The expression GAL-R1, another appetite-stimulating regulator, was also analyzed. We found that the expression level of GAL-R1 mRNA tended to decrease in the starved group compared to the fed group. This result showed a different pattern from the previous study (Li et al., 2013), indicating that GAL was increased to stimulate food intake and appetite in starving conditions. Contrary to the results of previous studies, the result of the present study may be related to the observation that GAL neurons are located together with appetite suppressing factors like neurotensin, cocaine-, and amphetamine-regulated transcript (CART) neurons (Laque et al., 2013). This suggests that GAL expression may be regulated by the starving environment as well as by other factors. Additionally, Laque et al. (2013) mentioned that GAL expression is associated with 'galanin-expressing LepRb neurons (Gal-LepRb neurons)' found in the hypothalamus and its adjacent regions. Although general neurons are only involved in the ex- pression of one factor, Gal-LepRb neurons are also reported to express GAL when leptin is expressed. Therefore, despite the appetite-stimulating action of GAL, leptin, an appetite-suppressing regulator, also seems to regulate GAL expression, possibly ex- plaining the lack of increase in GAL expression despite continued starvation, which is similar to the results of the present study. This also suggests that GAL may be expressed for appetite promotion and other physiological functions. Thus, additional studies are required to clearly prove the causal relationship between neuronal stimulation and the expression of corresponding factors.
Analysis of the expression changes in CRH, an appetite-stimulating regulator in contrast to HCRT and GAL-R1, revealed low expression levels with time in all experimental groups, except for the fed group. In particular, the starved group showed significantly lower CRH expression when compared to the re-fed group. It is presumed that CRH expression, which was decreased due to starvation, was partially restored due to re-feeding. Wang et al. (2014) reported that CRH expression decreased after 7 days of starving, and its expression level increased through subsequent re-feeding in Ya-fish Schizothorax prenanti. Therefore, the high expression of CRH in the re-fed group compared to that in the starved group in the present study appears to result from in- creased CRH expression by re-feeding.
The plasma concentration of leptin, an appetite suppressant regulator like CRH, showed no changes with starving and re-feeding. It is presumed that feeding and re-feeding olive floun- der for 2 weeks does not directly cause a significant change in leptin concentrations. Volkoff (2015) reported no difference in leptin expression changes in the brains of Red-bellied piranha Pygocentrus nattereri subjected to 7 days of starving. Similarly, Tinoco et al. (2012) and Shpilman et al. (2014) also reported that starving did not significantly affect the leptin expression levels in fish. Such results are similar to those reported in the present study, suggesting that leptin may not be involved in the appetite control and feeding behavior induced by starving and re-feeding in fish. They also propose that this result may be related to the period of starving and re-feeding. In conclusion, a 1-week re-feeding period induced effective changes in appetite response compared to a 2-week starving period. Even if the re-feeding is performed after starving, the balance caused by re-feeding can affect various physiological changes in fish by feed intake efficiency. In addition, the results of this study differ from previous studies, such as decreased expression of HCRT and GAL-R1 mRNA (known as appetite-stimulating regulators) during starving, suggesting the possibility of complex interactions between various neurons in the central nervous system and peripheral nervous system, rather than a single regulatory factor, 'food intake'. As we only investigated the effect of fasting and re-feeding on the changes in appetite-related genes in olive flounder for a certain period, this study provides basic research data related to the physiological processes in fish under limited feeding conditions.
- References
-
1. Ahima RS, Saper CB, Flier JS, Elmquist JK. 2000. Leptin regulation of neuroendocrine systems. Front Neuroendocrinol 21: 263-307. http://doi.org/10.1006/frne.2000.0197.

-
2. Ali M, Nicieza A, Wootton RJ. 2003. Compensatory growth in fishes: a response to growth depression. Fish Fish 4: 147-190. http://doi.org/10.1046/j.1467-2979.2003.00120.x.

-
3. Bar N. 2014. Physiological and hormonal changes during pro- longed starvation in fish. Can J Fish Aquat Sci 71: 1447-1458. http://doi.org/10.1139/cjfas-2013-0175.
-
4. Barson JR, Leibowitz SF. 2017. Orexin/hypocretin system: role in food and drug overconsumption. Int Rev Neurobiol 36: 199-237. http://doi.org/10.1016/bs.irn.2017.06.006
-
5. Bernier NJ. 2006. The corticotropin-releasing factor system as a mediator of the appetite-suppressing effects of stress in fish. Gen Comp Endocrinol 146: 45-55. http://doi.org/10.1016/ j.ygcen.2005.11.016.
-
6. Bernier NJ, Peter RE. 2001. Appetite-suppressing effects of urotensin I and corticotropin-releasing hormone in goldfish (Carassius auratus). Neuroendocrinology 73: 248-260. http://doi.org/ 10.1159/000054642.
-
7. Butler JM, Herath EM, Rimal A, Whitlow SM, Maruska KP. 2020. Galanin neuron activation in feeding, parental care, and in- fanticide in a mouthbrooding African cichlid fish. Horm Behav 126: 104870. http://doi.org/10.1016/j.yhbeh.2020.104870.
-
8. Cho SH. 2014. Effects of food deprivation and feeding ratio on the growth, feed utilization and body composition of juvenile olive flounder Paralichthys olivaceus. Fish Aquatic Sci 17: 449-454. doi: 10.5657/FAS.2014.0449. http://doi.org/10.5657/ FAS.2014.0449.
-
9. Cho SH, Lee SM, Park BH, Ji SC, Lee J, Bae J, Oh SY. 2006. Compensatory growth of juvenile olive flounder, Paralichthys olivaceus L., and changes in proximate composition and body condition indexes during fasting and after refeeding in summer season. J World Aquac Soc 37: 168-174. http:// doi.org/10.1111/j.1749-7345.2006.00023.x.
-
10. Choi CY, Choi JY, Choi YJ, Yoo JH. 2018. Physiological effects of various light spectra on oxidative stress by starvation in olive flounder, Paralichthys olivaceus. Mol Cell Toxicol 14: 399-408. http://doi.org/10.1007/s13273-018-0044-y.
-
11. Choi CY, Song JA, Lee TH, Park YS. 2021. Effect of green wave- length light on stress and appetite responses of olive floun- der (Paralichthys olivaceus) following feed deprivation and re-feeding. Aquac Rep 19: 100605. http://doi.org/10.1016/ j.aqrep.2021.100605.
-
12. Chu DLH, Li VWT, Yu RMK. 2010. Leptin: clue to poor appetite in oxygen-starved fish. Mol Cell Endocrinol 319: 143-146. http:// doi.org/10.1016/j.mce.2010.01.018.
-
13. Crespi EJ, Vaudry H, Denver RJ. 2004. Roles of corticotropin-releasing factor, neuropeptide Y and corticosterone in the regulation of food intake in Xenopus laevis. J Neuroendocrinol 16: 279-288. http://doi.org/10.1111/j.0953-8194.2004.01168.x.
-
14. Erhuma A, Bellinger L, Langley-Evans SC, Bennett AJ. 2007. Prenatal exposure to undernutrition and programming of responses to high-fat feeding in the rat. Br J Nutr 98: 517-524. http:// doi.org/10.1017/S0007114507721505.
-
15. Holzer-Petsche U, Moser RL. 1993. Pharmacological evidence for the release of galanin from rat stomach. Neuropeptides 25: 47-50. http://doi.org/10.1016/0143-4179(93)90067-K.
-
16. Iwasa T, Matsuzaki T, Munkhzaya M, Tungalagsuvd A, Kuwahara A, Yasui T, Irahara M. 2015. Developmental changes in the hypothalamic mRNA levels of prepro-orexin and orexin re- ceptors and their sensitivity to fasting in male and female rats. Int J Dev Neurosci 46: 51-54. http://doi.org/10.1016/ j.ijdevneu.2015.07.005.
-
17. Laque A, Zhang Y, Gettys S, Nguyen TA, Bui K, Morrison CD, Münzberg H. 2013. Leptin receptor neurons in the mouse hypothalamus are colocalized with the neuropeptide galanin and mediate anorexigenic leptin action. Am J Physiol Endo- crinol Metab 304: E999-E1011. http://doi.org/10.1152/ ajpendo.00643.2012.
-
18. Li L, Wei S, Huang Q, Feng D, Zhang S, Liu Z. 2013. A novel galanin receptor 1a gene in zebrafish: tissue distribution, develop- mental expression roles in nutrition regulation. Comp Biochem Physiol B Biochem Mol Biol 164: 159-167. http://doi.org/ 10.1016/j.cbpb.2012.12.004.c
-
19. Livak KJ, Schmittgen TD. 2001. Analysis of relative gene expression data using real-time quantitative PCR and the 2-ΔΔCT method. Methods 25: 402-408. http://doi.org/10.1006/meth.2001.1262.
-
20. McCue MD. 2010. Starvation physiology: reviewing the different strategies animals use to survive a common challenge. Comp Biochem Physiol A Mol Integr Physiol 156: 1-18. http:// doi.org/10.1016/j.cbpa.2010.01.002.
-
21. Navarro I, Gutierrez J. 1995. Fasting and starvation. Fish Physiol Biochem 4: 393-434. http://doi.org/10.1016/S1873-0140(06) 80020-2.c
-
22. Novak CM, Jiang X, Wang C, Teske JA, Kotz CM, Levine JA. 2005. Caloric restriction and physical activity in zebrafish (Danio rerio). Neurosci Lett 383: 99-104. http://doi.org/10.1016/ j.neulet.2005.03.048.c
-
23. O'Donnell D, Ahmad S, Wahlestedt C, Walker P. 1999. Expression of the novel galanin receptor subtype GALR2 in the adult rat CNS: distinct distribution from GALR1. J Comp Neurol 409: 469-481. http://doi.org/10.1002/(SICI)1096-9861(19990705) 409:3<469::AID-CNE10>3.0.CO;2-Q.
-
24. Pedro ND, Céspedes MV, Delgado MJ, Alonso-Bedate M. 1995. The galanin-induced feeding stimulation is mediated via α2-adrenergic receptors in goldfish. Regul Pept 57: 77-84. http://doi.org/10.1016/0167-0115(95)91255-4.
-
25. Shpilman M, Hollander-Cohen L, Ventura T, Gertler A, Levavi-Sivan B. 2014. Production, gene structure and character- ization of two orthologs of leptin and a leptin receptor in tilapia. Gen Comp Endocrinol 207: 74-85. http://doi.org/ 10.1016/j.ygcen.2014.05.006.
-
26. Stanley S, Wynne K, McGowan B, Bloom S. 2015. Hormonal regu- lation of food intake. Physiol Rev 85: 1131-1158. http:// doi.org/10.1152/physrev.00015.2004.
-
27. Tinoco AB, Nisembaum LG, Isorna E, Delgado MJ, Pedro ND. 2012. Leptins and leptin receptor expression in the goldfish (Carassius auratus). Regulation by food intake and fasting/ overfeeding conditions. Peptides 34: 329-335. http://doi.org/ 10.1016/j.peptides.2012.02.001.
-
28. Volkoff H. 2015. Cloning, tissue distribution and effects of fasting on mRNA expression levels of leptin and ghrelin in red-bellied piranha (Pygocentrus nattereri). Gen Comp Endocrinol 217: 20-27. http://doi.org/10.1016/j.ygcen.2015.05.004.
-
29. Volkoff H, Bjorklund JM, Peter RE. 1999. Stimulation of feeding behavior and food consumption in the goldfish, Carassius auratus, by orexin-A and orexin-B. Brain Res 846: 204-209. http://doi.org/10.1016/S0006-8993(99)02052-1.
-
30. Volkoff H, Canosa LF, Unniappan S, Cerda-Reverter JM, Bernier NJ, Kelly SP, Peter RE. 2005. Neuropeptides and the control of food intake in fish. Gen Comp Endocrinol 142: 3-19. http:// doi.org/10.1016/j.ygcen.2004.11.001.
-
31. Volkoff H, Unniappan S, Kelly SP. 2009. The endocrine regulation of food intake. Fish Physiol 28: 421-465. http://doi.org/10.1016/ S1546-5098(09)28009-5.
-
32. Volkoff H, Xu M, MacDonald E, Hoskins L. 2009. Aspects of the hormonal regulation of appetite in fish with emphasis on goldfish, Atlantic cod and winter flounder: notes on actions and responses to nutritional, environmental and reproductive changes. Comp Biochem Physiol A Mol Integr Physiol 153: 8-12. http://doi.org/10.1016/j.cbpa.2008.12.001.
-
33. Wang T, Zhou C, Yuan D, Lin F, Chen H, Wu H, Wei R, Xin Z, Liu J, Gao Y, Li Z. 2014. Schizothorax prenanti corticotropin-releasing hormone (CRH): molecular cloning, tissue expres- sion, and the function of feeding regulation. Fish Physiol Biochem 40: 1407-1415. http://doi.org/10.1007/s10695-014-9935-6.
-
34. Williams G, Bing C, Cai XJ, Harrold JA, King PJ, Liu XH. 2001. The hypothalamus and the control of energy homeostasis: dif- ferent circuits, different purposes. Physiol Behav 74: 683-701. http://doi.org/10.1016/S0031-9384(01)00612-6.
-
35. Wu L, Xie S, Zhu X, Cui Y, Wootton RJ. 2002. Feeding dynamics in fish experiencing cycles of feed deprivation: a comparison of four species. Aquac Res 33: 481-489. http://doi.org/10.1046/ j.1365-2109.2002.00733.x.
-
36. Wynne K, Stanley S, McGowan B, Bloom S. 2005. Appetite control. J Endocrinol 184: 291-318. http://doi.org/10.1677/joe.1.05866.
-
37. Zorrilla EP, Brennan M, Sabino V, Lu X, Bartfai T. 2007. Galanin type 1 receptor knockout mice show altered responses to high-fat diet and glucose challenge. Physiol Behav 91: 479-485. http://doi.org/10.1016/j.physbeh.2006.11.011.
Copyright (C) 2024. The Korean Society of Marine Life Science