


JMLS 2021 June;6(1):9-22. Epub 2021 May 31
Copyright © 2021 by The Korean Society of Marine Life Science
Bacterial Communities from the Water Column and the Surface Sediments along a Transect in the East Sea
Jeong-Kyu Lee; Department of Marine Environmental Science, Chungnam National University, Daejeon 34134, Korea
Keun-Hyung Choi; Department of Marine Environmental Science, Chungnam National University, Daejeon 34134, Korea
- Abstract
We determined the composition of water and sediment bacterial assemblages from the East Sea using 16S rRNA gene sequencing. Total bacterial reads were greater in surface waters (<100 m) than in deep seawaters (>500 m) and sediments. However, total OTUs, bacterial diversity, and evenness were greater in deep seawaters than in surface waters with those in the sediment comparable to the deep sea waters. Proteobacteria was the most dominant bacterial phylum comprising 67.3% of the total sequence reads followed by Bacteriodetes (15.8%). Planctomycetes, Verrucomicrobia, and Actinobacteria followed all together consisting of only 8.1% of the total sequence. Candidatus Pelagibacter ubique considered oligotrophic bacteria, and Planctomycetes copiotrophic bacteria showed an opposite distribution in the surface waters, suggesting a potentially direct competition for available resources by these bacteria with different traits. The bacterial community in the warm surface waters were well separated from the other deep cold seawater and sediment samples. The bacteria exclusively associated with deep sea waters was Actinobacteriacea, known to be prevalent in the deep photic zone. The bacterial group Chromatiales and Lutibacter were those exclusively associated with the sediment samples. The overall bacterial community showed similarities in the horizontal rather than vertical direction in the East Sea.
Keywords: Bacterial community Metagenomics the East Sea Massive parallel sequencing
Correspondence to: Keun-Hyung Choi; Department of Marine Environmental Science, Chungnam National University, Daejeon 34134, Korea; E-mail : keunhchoi@cnu.ac.kr
- Received
- 22 March 2021;
- Revised
- 12 April 2021;
- Accepted
- 26 April 2021.
This is an Open Access article distributed under the terms of the Creative Commons Attribution Non-Commercial License (http://creativecommons.org/licenses/by-nc/3.0/) which permits unrestricted non-commercial use, distribution, and reproduction in any medium, provided the original work is properly cited.
Language: Korean/English,
Full Text:

Introduction
Bacteria are recognized as important agents in biogeochemical processes in all aquatic ecosystems, including sediments. They are involved not only in the re-mineralization of organic matter both in water and sediments, but they also play major roles in food web structure and dynamics (Azam, 1998; Azam et al., 1983; Guilini et al., 2010). Studies show not only short-term but also long-term bacterial responses to environmental changes (Giovannoni and Vergin, 2012). Therefore, their composition reflects the environ- mental characters in which they are living and their changes over time (Walsh et al., 2015).
The extent of the diversity of marine prokaryotes is not well known, primarily because of poor cultivability. Techniques permit the characterization of such organisms without culturing using 16S rRNA sequences as templates for the polymerase chain reaction (PCR) obtained directly from biomass (Britschgi and Giovannoni, 1991; Fuhrman et al., 1993b). For more than a decade, Sanger sequencing and fluorescence-based electrophoresis technologies have dominated the DNA sequencing field. The potential of terminal-restriction fragment length polymorphism (T-RFLP) and denaturing gradient gel electrophoresis (DGGE) have been exten- sively used to separate and detect OTUs and thus to characterize marine bacterioplankton communities (Moeseneder et al., 1999).
Recent progress concerning the genomics method, especially development of massive parallel genomic sequencing (Rothberg and Rothberg, 2015) in high-throughput DNA sequencing and high-performance computing and bioinformatics, has caused a substantial expansion in genomic discovery (Cottrell et al., 2005; Rogers and Venter, 2005). Surveys using this extensive parallel sequencing have been performed in many marine environments, including estuarine and coastal waters (Feng et al., 2009; Pommier et al., 2010), oligotrophic open ocean (Pommier et al., 2010; Agogué et al., 2011), and marine sediments (Agogué et al., 2011; Bolhuis and Stal, 2011; Sogin et al., 2006). These studies could contribute to improve the overall understanding of the global patterns of marine bacterial diversity (Ladau et al., 2013) and to comprehend local and global biogeochemical processes (DeLong, 2009).
However, even with improved molecular tools, our understanding of microbial diversity in aquatic environments is still limited due not only to the highly variable physical and biogeochemical con- ditions but also to the sometimes difficult access in sampling (such high sea and deep-sea environments). Spatial variations in the bacterial community along environmental gradients or across environments could provide a better picture of bacterial distribution and community structure (Walsh et al., 2015).
The East Sea is a deep, semi-enclosed marginal sea located in the northwest Pacific. It is also called a "miniature ocean" due to the similarity of its dynamic characteristics with that of a global ocean (Ichiye, 1984). The Tsushima Warm Current (TWC) supplies heat, water, and materials horizontally through the Tsushima/ Korea Straits (TKS) to the East Sea with double peaks of volume transport in May and October. Nitrogen fluxes through the western channel of the Tsushima/Korea Straits (TKS) sustain high primary productivity in the southwestern Japan Sea (Onitsuka et al., 2007), affecting ecosystem dynamics in the East Sea.
In this study we used 16S rRNA sequencing to determine the composition of water and sediment bacterial assemblages in the East Sea. The study area sits on various geomorphic features from the coastal to continental basin encompassing continental shelf and slope and partly covering the area the Tsushima Warm Current (TWC)'s influence. Our primary focus was to find spatial patterns of bacterial communities and to gain an overall understanding of bacterial diversity in this marine system affected by the TWC. We also tried to compare bacterial communities in the warm surface water, cold deep-sea environments, and sediments in the East Sea.
Materials and Methods
1. Site description, sample collection and characterization
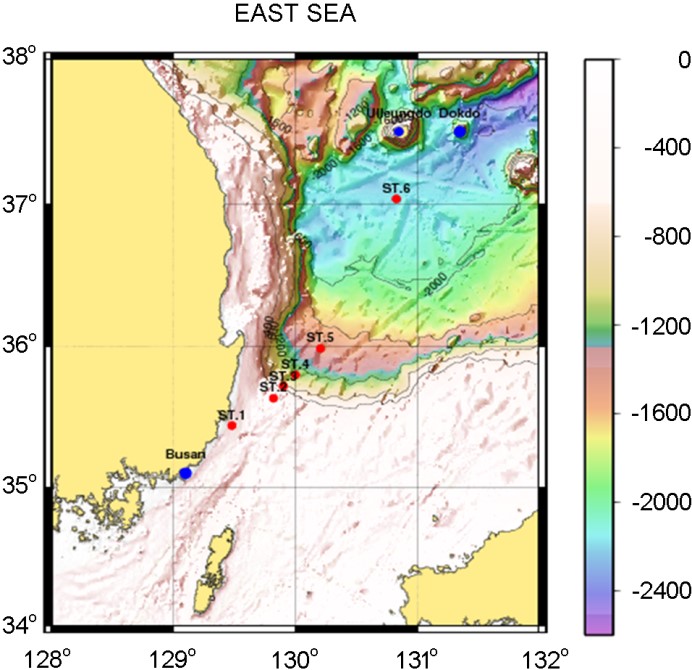
Seawater samples were collected at several depths from the surface to the bottom at six stations along a transect from the coastal to the open sea deep basin in the East Sea in May 2017 (Fig. 1). The sampling stations were selected to capture the influence of the Tsushima Warm Current (TWC) flowing north along the transect during the cruise. Water sampling was done at several depths, mostly on the surface (generally <100 m) for all stations. Deep water samples were also collected, and sampling often reached down to the bottom (600 m at ES4, 1,400 m at ES5, and 1,900 and 2,100 m at ES6).
Standard oceanographic properties, including water temperature, salinity, fluorescence, and dissolved oxygen were measured. Tem- perature and salinity profiles were obtained for the downward casts of conductivity, temperature, and depth (CTD) rosette pro- filer (Seabird-911, Sea-Bird Scientific Ltd., USA) only to 200 m. Dissolved oxygen (DO) and fluorescence were also measured during the casts with a multi-sonde attached to the CTD profiler. The water samples were collected using Niskin bottles attached to the rosette multi-sampler. Phosphate samples were frozen on board following filtration through 47 mm GFF filters, and its con- centration was quantified spectrophotometrically in the laboratory (spectrophotomer: Cary 100 UV-VIS, Varian Inc., Palo Alto, USA) following Grasshoff et al. (Grasshoff et al., 2009). For bacterial analysis, water samples of 1 ℓ at each sampling depth were filtered onto 47 mm 0.2 μm cellulose ester membrane filters (Advantec Nissei Kaisha, Ltd., Japan), and the filters were immediately placed in 15 ml tubes in liquid nitrogen. Surface sediment samples were collected using a box corer (BX-610 Box Corer, Ocean Instruments, San Diego, USA). All apparatus for filtering waters and sediment sampling were sterilized with 80% ethanol and air-dried prior to sampling to reduce bacterial contamination.
2. Nucleic acid extractions and high-throughput sequencing of 16S rRNA
Each sequenced sample was prepared according to the Illumina 16S Metagenomic Sequencing Library protocols. Both DNA quan- tification and quality were measured by PicoGreen® (Thermo Fisher Scientific Inc., Waltham, MA, USA) and NanodropTM (Thermo Fisher Scientific Inc., Waltham, MA, USA). The 16S rRNA genes were amplified using 16S V3-V4 primers: 16S Amplicon PCR Forward Primer (5'TCGTCGGCAGCGTCAGATGTGTATAAGAGACAGCCTACG- GGNGGCWGCAG), and 16S Amplicon PCR Reverse Primer (5'- GTCTCGTGGGCTCGGAGATGTGTATAAGAGACAGGACTACHVGGGT- ATCTAATCC). Input gDNA (12.5 ng) was amplified with 16S V3-V4 primers, and a subsequent limited-cycle amplification step was performed to add multiplexing indices and Illumina sequencing adapters. The final products were normalized and pooled using PicoGreen®, and the size of libraries were verified using the LabChip GX HT DNA High Sensitivity Kit (PerkinElmer Inc., Waltham, MA, USA). The amplicons were finally sequenced using the MiSeqTM platform (Illumina Inc., San Diego, CA, USA).
3. Sequencing data processing
2. Overview of sequence reads
Using 16S rRNA gene Illumina sequencing, a total 6,637,818 high quality reads were generated from 30 samples with an average of 214,123 reads/sample (minimum reads/sample = 106,638; max- imum read/sample = 320,370). Because of the uneven sequencing depth, 100,000 randomly selected paired end reads per sample from the initial clean reads were retained for further analysis (supplementary Table S1). After quality control filtering and chimera removal, the reads were clustered into 3,225 OTUs. After classification using the SILVA database classifier at a confidence threshold of 97%, 64% (19,860 sequences) of all qualified reads were assigned to the Bacteria domain. One particular OTU, iden- tified as a Burkholderia, comprised >70% of the total reads and even made up >90% of the total reads from sediment. Such over- whelming dominance of one particular OTU might have been an artifact, and as such, this OTU was removed for further analysis.
3. Total OTUs and bacterial diversity
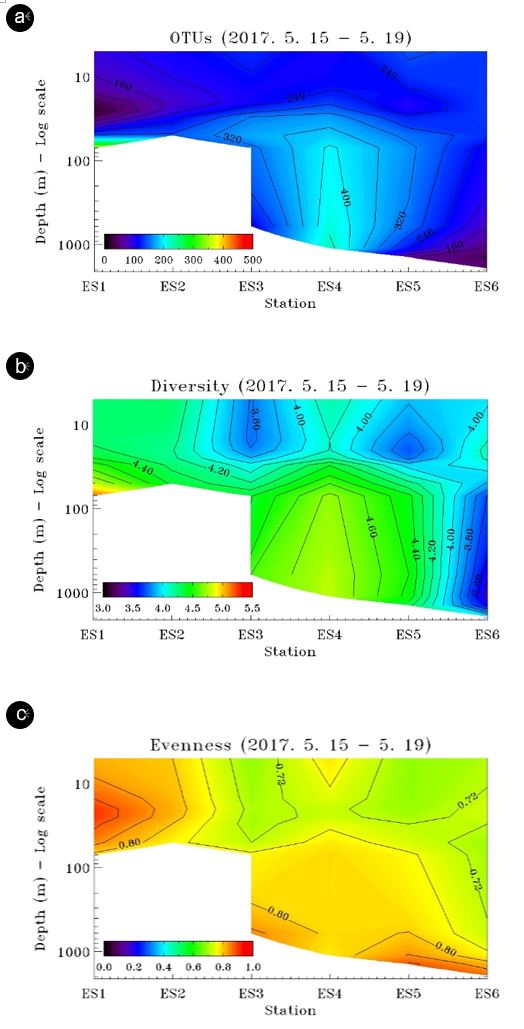
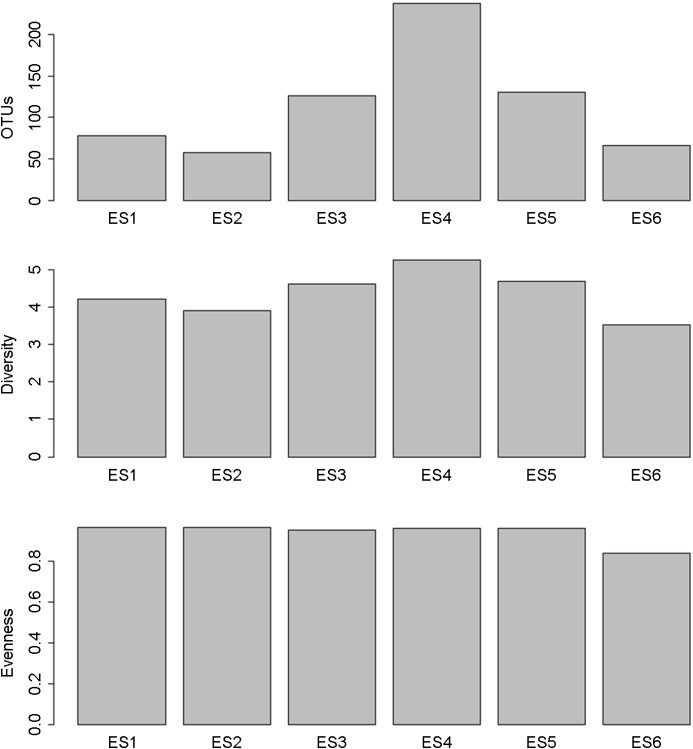
Total OTUs ranged from 99 to 714 (mean 268±125) for the water column and from 57 to 238 (mean 133±77) in the sedi- ments (Fig. 3a, 4). The variation was similar with a coefficient of variation (CV) of 46% for the water column and 58% for the sedi- ments. For OTUs in the water column, their numbers generally were higher in the deeper parts of the stations and were lower in the coastal surface layer and the deepest part of station ES6 (Fig. 3a). Although lower OTUs were found in the sediments than in the water column, it appeared that total OTUs in the sediment environment generally followed the pattern in the overlying water column with the highest OTU observed at station ES4 (Fig. 4).
Bacterial diversity ranged from 3.79 to 5.22 (mean 4.28±0.36) in the water column and from 3.52 to 5.33 (mean 4.50±0.67) in the sediment (Fig. 3b and 4). The variation was larger in the sediment a CV of 15% as compared to 8% in the water column. Bacterial diversity generally followed the pattern of the OTU distribution. Diversity in the coastal station was higher compared to deep stations and appeared to rise at depth (Fig. 3b). At deep water stations ES3-5, diversity in the surface layer was low but high at mid-depth and deep waters.
Bacterial evenness ranged from 0.69 to 0.92 (mean 0.78±0.07) in the water column and from 0.87 to 0.97 (mean 0.95±0.05) in the sediment (Fig. 3c and 4). The variation, however, was larger in the water column with a CV of 9% as compared to 5% in the sediment. Evenness generally followed a pattern similar to that of diversity, high in coastal water and at deep waters of open water stations.
Figure #3
4. Major bacterial taxa and their distribution
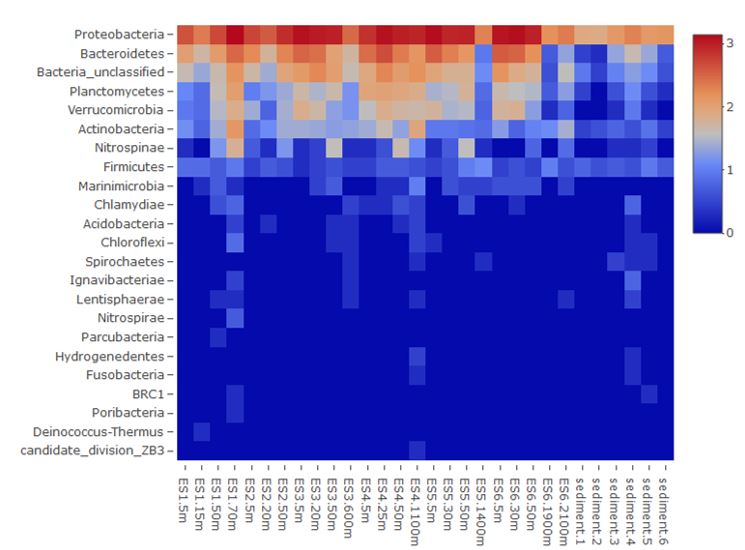
A total of 22 bacterial phyla, including an unclassified one, were detected in this study (Fig. 5). Proteobacteria was the most dominant bacterial phylum in the water samples and comprised 67.3% of the total sequence reads followed by Bacteriodetes (15.8%). Planctomycetes, Verrucomicrobia, and Actinobacteria fol- lowed next, all together consisting of only 8.1% of the total sequence reads (Fig. 5). Deep sea water samples contained lower reads compared to surface water samples. Relatively lower reads were detected in the sediment than in the overlying water columns for the major Proteobateria and Bacteriodetes phyla (Fig. 5).
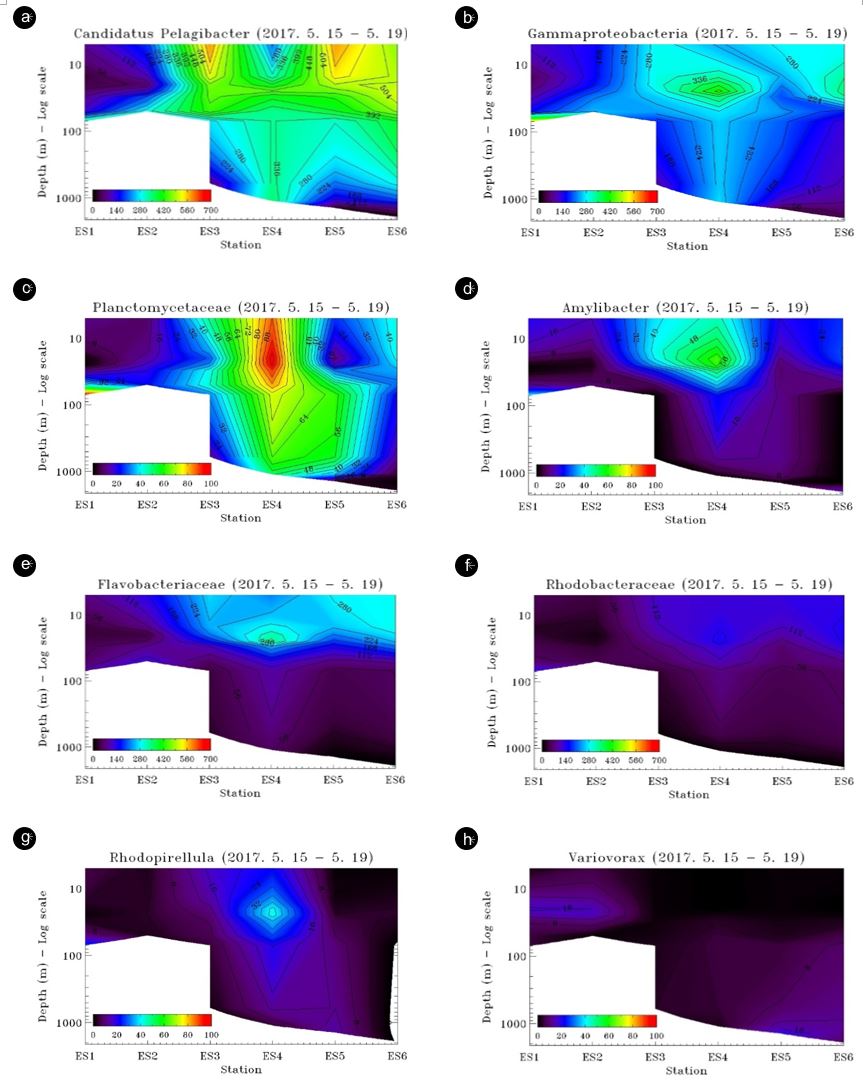
The main bacterial OTUs sharply increased moving through station ES4 and to the north (Fig. 5). Candidatus Pelagicbacter, Gammaproteobacteria, and Planctomycetaceae bacteria were distributed extensively through the water column except in coastal waters in which their abundance was very low (<200 reads) (Fig. 6). Flavobacteriaceae, Amylibacteria, and Rhodopirulle rhodo- bacteria Rhodopirellula were largely concentrated in the surface layer, but they also exhibited low abundance in coastal waters (Fig. 6). Variovax was more abundant in the subsurface waters although their presence was small. Many of these bacteria were highly concentrated at station ES4's water column with an opposing Candidatus Pelagicbacter distribution pattern, which showed the highest abundance away from ES4.
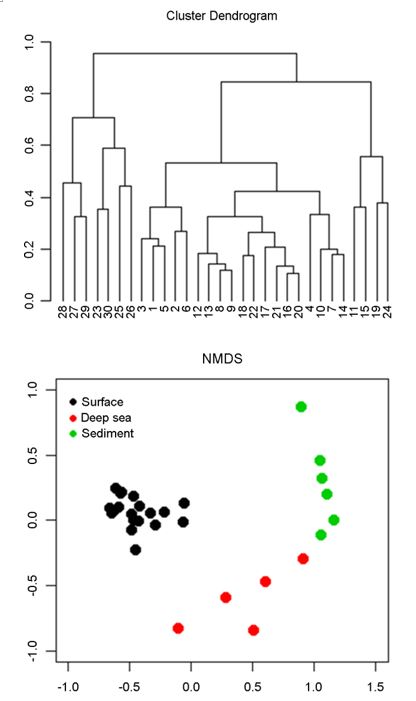
Non-metric dimensional scaling (NMDS) was performed with the data of the top 10 most abundant OTUs for each sampling site, which resulted in a total of 77 OTUs for analysis. NMDS results showed differences between the bacterial communities of the upper water columns and those of the deep-sea seawater and the sediment samples (Fig. 7). Cluster analysis displayed similar results to those obtained from NMDS analysis. The analysis of similarities based on the dissimilarity matrix of the bacterial OTUs among the samples showed that separation into three groups based on the cluster analysis and NMDS were statistically well-supported (r = 0.97, p < 0.001).
Indicator species analysis was further performed (Cáceres and Legendre, 2009) to determine indicators of site groups using the OTU data (Table 1). We used the R Package 'indicspecies' by the same authors, which allows indicators to consist of species com- binations in addition to single species. For surface water samples, 22 bacterial OTUs were associated (such as group 1, p <0.05), whereas eight bacterial OTUs were in Group 2 (deep-sea seawater samples), and just four OTUs in Group 3 (sediment samples).


Discussion
1. Major bacterial taxa
In the current study, proteobacteria (Alphaproteobacteria and Gammaproteobacteria) were predominant in water and sediment samples (Fig. 5). This finding is consistent with previous studies showing that these bacteria are dominant in marine environments (Feng et al., 2009; Sekiguchi et al., 2002; Seo et al., 2017). In the South Sea of Korea located southwest of the current study area, the majority of the 19,860 sequences were affiliated with Alpha- proteobacteria (58.2%), Gammaproteobacteria (7.9%), and Bac- teroidetes (13.9%). Alphaproteobacteria was the most abundant bacterial class. In the Changjiang Estuary and the East China Sea, Proteobacteria (72.9%) was the most abundant phylum, followed by Firmicutes (6.4%), Bacteroidetes (4.6%), and Actinobacteria (4.1%) (Feng et al., 2009). Actinobacteria were abundant in the Changjiang Estuary in addition to the South Sea and the East China Sea surface waters (Seo et al., 2017). Rhodobacteraceae were also abundant in the South Sea of Korea.
Gammaproteriobacteria also dominated in the sediments as well (Fig. 6). In Changjiang Estuary, Proteobacteria were the most abundant phyla in the sediment samples (73%). Previous studies also showed that Proteobacteria were the dominant bacterial phylogenetic lineage in most surface marine sediments, often comprising >50% of the microbial biomass (Ravenschlag et al., 2001). Furthermore, it seems that Gammaproteobacteria was the most significant clade present in most marine sediments (Dyksma et al., 2016; Franco et al., 2017; Ravenschlag et al., 2001). For example, in the upper 2-cm layer of sediment, Gammaproteo- bacteria accounted for up to 10.5% of the total cell counts and 20% of prokaryotic rRNA in the Smeerenburgfjorden sediments (Ravenschlag et al., 2001).
Some of the dominant bacteria at family or genus level (Fig. 6) are known to be important in in the ocean surface water carbon cycle. Pelagibacter is an abundant member of the SAR11 clade in the phylum Alphaproteobacteria. SAR11 members and its rela- tives may be the most abundant organisms in the ocean (Henson et al., 2018), and it can comprise about 25% of all microbial plankton cells. During the summer, they may account for approxi- mately half the cells present in temperate ocean surface waters (Morris et al., 2002). The family Flavobacteriaceae comprises more than 100 genera (http://www.bacterio.cict.fr), constituting a major phylogenetic group within the phylum Bacteroidetes (Bernardet and Nakagawa, 2006). Many members of the family Flavobac- teriaceae originated from marine environments. The Cytophaga-Flavobacterium cluster within the phylum Bacteroidetes often accounts for >10% of the total microbial community in coastal and offshore waters (Barbeyron et al., 2008). Moreover, flavobacteria have been found in high abundance during natural and induced phytoplankton blooms, suggesting utilization of polymeric organic matter in marine systems (Kirchman, 2002).
Planctomycetes include free-living in addition to attached organisms. These highly diverse bacteria have been proposed to contribute to the global carbon cycle via turnover of complex car- bohydrates in marine sediments and marine snow (Glöckner et al., 2003; Žure et al., 2015a). They possess phenotypic characteristics unusual for the domain Bacteria, including reproduction by bud- ding, and an intracellular membrane-bounded compartmentali- zation (Jenkins et al., 2002). Planctomycetes Rhodobacteraceae are deeply involved in sulfur and carbon biogeochemical cycling and symbiosis with aquatic micro- and macro-organisms (Pujalte et al., 2014). Rhodopirellula is an abundant marine member of the bacterial phylum Planctomycetes. Cultivation studies revealed the presence of several closely related Rhodopirellula species in coastal sediments of the North Sea (Žure et al., 2015b). The genus Rhodopirellula also belongs to the widespread bacterial phylum Planctomycetes (Wagner and Horn, 2006).
Relatively little information is available for Amylibacter, a genus of the bacterial family, Rhodobacteraceae. A few species have been isolated from marine hosts, and Amylibacter marinus appears to be the only bacteria that has been isolated from surface seawater (Teramoto and Nishijima, 2014). As members of the family Coma- monadaceae (Betaproteobacteria), the genus Variovorax has been found to inhabit diverse environments, including the ice surfaces of glaciers (Ciok et al., 2016), soils (Yoon et al., 2006) and deep marine sediments (Wang and Gu, 2006).
2. Community structure among different habitats
The bacteria exclusively associated with Group 2 (deep sea- waters) was Actinobacteriacea (Table 1). These organisms appear to be prevalent in the deep photic zone at or around the deep chlorophyll maximum. Marine actinobacterial groups may be also important players for nutrient cycling in the marine environment (Mizuno et al., 2015). Our results indicate that they can extend their habitat to deep cold seawaters. The bacterial group Chroma- tiales (class Gammaproteobacteria) and Lutibacter (family Flavo- bacteriaceae) were those exclusively associated with the sediment samples (Table 1). Chromatiales are generally known as sulfur-oxidizing Gammaproteobacterium (A Bazylinski et al., 2016), and their importance in the sulfur cycle has only recently gained atten- tion (Lavy et al., 2018). Lutibacter bacteria are common to tidal flat sediments and are non-spore forming, facultative anaerobic (Choi et al., 2013; Choi and Cho, 2006) and carotenoid-containing chemoheterotrophs (Sundararaman and Lee, 2017). Thus, the presence of these bacteria from the coastal sediment to the deep ocean basin suggests a role for sulfur and organic carbon cycling in the East Sea sediment. Such clustering of the sediment bacterial community despite wide environmental gradients was also observed in the sediment samples collected from the Changjiang Estuary and the East China Sea (Feng et al., 2009). Clustering of bacteria collected from the sediment supports the general feature that bacterial types are widely dispersed in similar habitat types (Feng et al., 2009; Fuhrman et al., 1993a; Mullins et al., 1995).
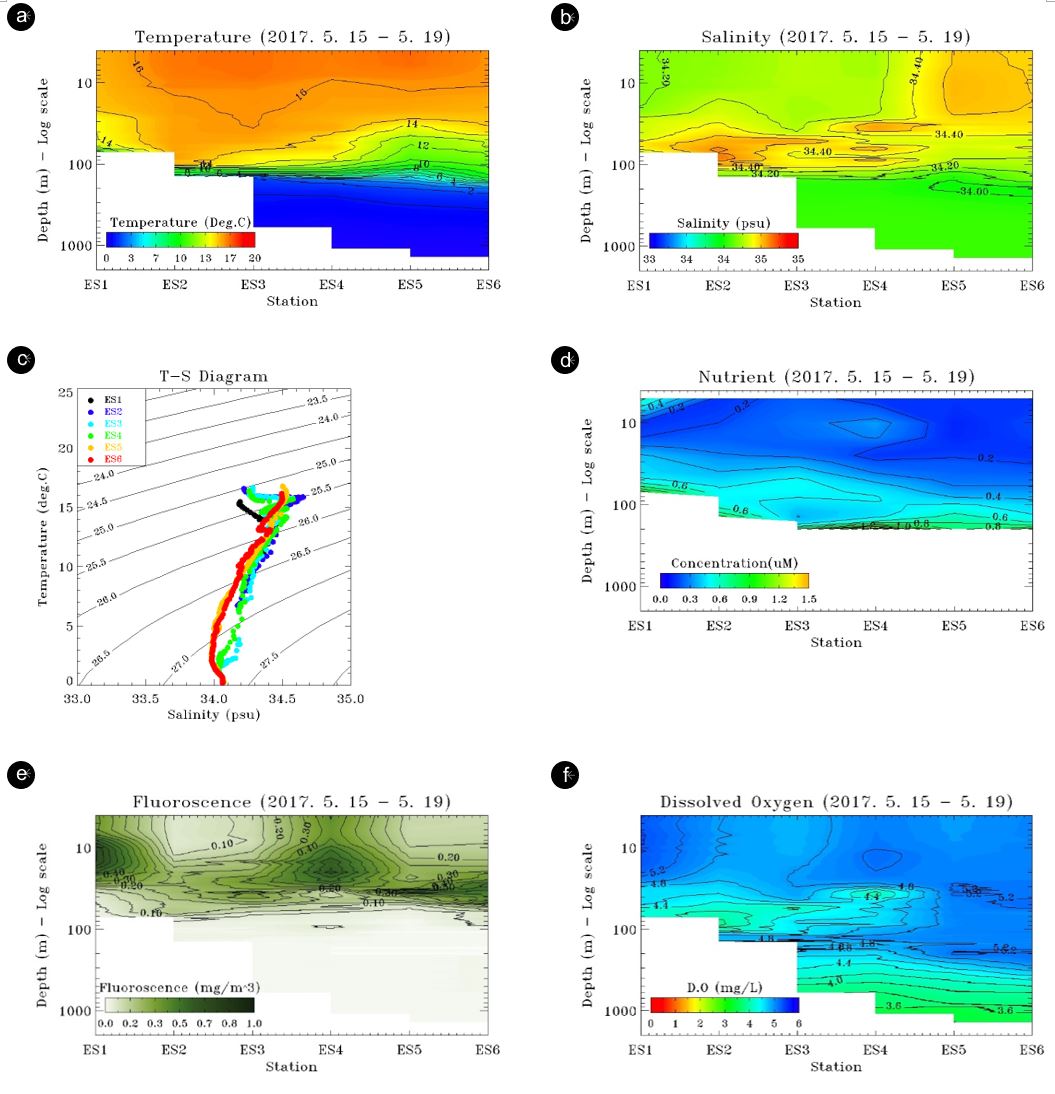
3. Influence of The Tsushima Warm Current
The TWC flows into the East Sea through the Korea/Tsushima Strait and then continues along the Japanese and Korean coasts to higher latitudes in the East Sea. It shows that water density is primarily regulated by temperature, and the intrusion of the water mass of low salinity and high seawater temperature into the surface layer indicates transport of TWC into the region, most likely between stations ES1/ES2 and ES4 (Fig. 2). The influence of the TWC seems to be limited to ES4 at the study transect, the point at which the continental slope ends (Fig. 1) as TWC may flow further north and is not involved the current study area. However, TWC's downward effects are clearly limited in the surface layers from 30 to 70 m (Fig. 2) as indicated in downward heat supplied by the current (Onitsuka et al., 2007). To some extent, TWC intrusion in the surface water in the region appears to affect both bacterial communities and abundance. Major bacterial OTUs sharply increase between stations ES2 and ES4 (Fig. 5). Flavo- bacteriaceae, Amylibacteria, Rhodopirulle rhodobacteria, and Rhodopirellula were largely concentrated on the surface layer, but they also exhibited low abundance in coastal waters. However, the cluster analysis does not entirely support the differences in surface bacterial community influenced by the TWC from the East Sea water (Fig. 7) as it appears the association within the surface layer may be more closely related to bacterial depth distribution.
The confluence of two water masses of TWC and East Sea water mass may lead to such increased biological activity in association with the geomorphic feature along this transect at which point the continental shelf ends and the continental slope begins. These potential increased biological activities may account for the reduced level of DO at the subsurface layer compared to ambient environments (Fig. 3). Such enhanced biological activities may have occurred in the sediment environment as well (Fig. 4). The ES4 station had the highest diversity of sedimentary bacterial geno- types among all sampling stations in the study area, and ES4 also showed the highest number of Proteobacteria and Bateriodetes among the sediment samples (Fig. 5). The continental slope serves as a focus for the deposition of organic matter produced on continental shelf (Moriarty et al., 1991).
Many marine bacteria have evolved to grow optimally at either high (copiotrophic) or low (oligotrophic) nutrient concentrations, enabling different species to colonize distinct trophic habitats in the oceans. In general, oligotrophs, and not the more readily iso- latable copiotrophs, dominate the ocean's free-living microbial populations (Lauro et al., 2009). Candidatus Pelagibacter ubique is considered as oligotrophy (Giovannoni et al., 2005), whereas Planctomycetes, a group known to become dominant during phytoplankton blooms, have trophic signatures that can be de- scribed as copiotrophic with some traits of oligotrophy (Lauro et al., 2009; Morris et al., 2006). Their distribution can be seen as a direct competition over the resources and Candidatus Pelagibacter dominates where biological activity is high.
In summary, in the East Sea, bacterial community in the warm surface waters were well separated from the other deep cold seawater and sediment samples. Overall bacterial community showed more of similarity in horizontal than in vertical direction in the East Sea. The confluence of the warm Tsushima Currents and the more saline East Sea water appears to create an environment for enhanced biological activity as does the continental slope compared to other benthic environments. Distribution of oligo- trophic and copiotrophic bacteria in the surface waters suggest a potential direct competition of these bacteria of different traits over resources.
- References
-
1. A Bazylinski D, Morillo V, Lefévre C, Viloria NL, Dubbels B, Williams T. 2016. Endothiovibrio diazotrophicus gen. nov., sp. nov., a Novel Nitrogen-Fixing, Sulfur-Oxidizing Gammaproteobac- terium Isolated from a Salt Marsh.


-
2. Agogué H, Lamy D, Neal PR, Sogin ML, Herndl GJ. 2011. Water mass-specificity of bacterial communities in the North Atlantic revealed by massively parallel sequencing. Molecular Ecology 20: 258-274.
-
-
4. Azam F, Fenchel T, Field JG, Gray JS, Meyer-Reil LA, Thingstad F. 1983. The ecological role of water-column microbes in the sea. Marine Ecology Progress Series 10: 257-263.
-
5. Barbeyron T, Carpentier F, L'Haridon S, Schüler M, Michel G, Amann R. 2008. Description of Maribacter forsetii sp. nov., a marine Flavobacteriaceae isolated from North Sea water, and emended description of the genus Maribacter. International Journal of Systematic and Evolutionary Microbiology 58: 790- 797.
-
6. Bernardet J, Nakagawa Y. 2006. An introduction to the family Flavobacteriaceae, p 455-480. The prokaryotes 7.
-
7. Bolger AM, Lohse M, Usadel B. 2014. Trimmomatic: a flexible trimmer for Illumina sequence data. Bioinformatics 30: 2114-2120.
-
8. Bolhuis H, Stal LJ. 2011. Analysis of bacterial and archaeal diver- sity in coastal microbial mats using massive parallel 16S rRNA gene tag sequencing. The ISME Journal 5: 1701.
-
9. Britschgi TB, Giovannoni SJ. 1991. Phylogenetic analysis of a natural marine bacterioplankton population by rRNA gene cloning and sequencing. Applied and Environmental Microbiology 57: 1707-1713.
-
10. Cáceres MD, Legendre P. 2009. Associations between species and groups of sites: indices and statistical inference. Ecology 90: 3566-3574.
-
11. Campbell BJ, Kirchman DL. 2013. Bacterial diversity, community structure and potential growth rates along an estuarine salinity gradient. The ISME Journal 7: 210.
-
12. Choi A, Yang S-J, Cho J-C. 2013. Lutibacter flavus sp. nov., a marine bacterium isolated from a tidal flat sediment. Inter- national Journal of Systematic and Evolutionary Microbiology 63: 946-951.
-
13. Choi DH, Cho BC. 2006. Lutibacter litoralis gen. nov., sp. nov., a marine bacterium of the family Flavobacteriaceae isolated from tidal flat sediment. International Journal of Systematic and Evolutionary Microbiology 56: 771-776.
-
14. Ciok A, Dziewit L, Grzesiak J, Budzik K, Gorniak D, Zdanowski MK, Bartosik D. 2016. Identification of miniature plasmids in psychrophilic Arctic bacteria of the genus Variovorax. FEMS Microbiology Ecology 92: fiw043-fiw043.
-
15. Cole JR, Wang Q, Fish JA, Chai B, McGarrell DM, Sun Y, Brown CT, Porras-Alfaro A, Kuske CR, Tiedje JM. 2014. Ribosomal Data- base Project: data and tools for high throughput rRNA analysis. Nucleic Acids Research 42: D633-D642.
-
16. Cottrell MT, Waidner LA, Yu L, Kirchman DL. 2005. Bacterial diver- sity of metagenomic and PCR libraries from the Delaware River. Environmental Microbiology 7: 1883-1895.
-
-
18. Dyksma S, Bischof K, Fuchs BM, Hoffmann K, Meier D, Meyerdierks A, Pjevac P, Probandt D, Richter M, Stepanauskas R. 2016. Ubiquitous Gammaproteobacteria dominate dark carbon fixation in coastal sediments. The ISME Journal 10: 1939.
-
19. Edgar RC, Haas BJ, Clemente JC, Quince C, Knight R. 2011. UCHIME improves sensitivity and speed of chimera detection. Bioinformatics 27: 2194-2200.
-
20. Feng BW, Li XR, Wang JH, Hu ZY, Meng H, Xiang LY, Quan ZX. 2009. Bacterial diversity of water and sediment in the Changjiang estuary and coastal area of the East China Sea. FEMS Microbiology Ecology 70: 236-248.
-
21. Franco DC, Signori CN, Duarte RT, Nakayama CR, Campos LS, Pellizari VH. 2017. High prevalence of gammaproteobacteria in the sediments of admiralty bay and north bransfield Basin, Northwestern Antarctic Peninsula. Frontiers in Microbiology 8: 153.
-
22. Fuhrman J, McCallum K, Davis A. 1993a. Phylogenetic diversity of subsurface marine microbial communities from the Atlantic and Pacific Oceans. Applied and Environmental Microbiology 59: 1294-1302.
-
23. Fuhrman JA, McCallum K, Davis AA. 1993b. Phylogenetic diver- sity of subsurface marine microbial communities from the Atlantic and Pacific Oceans. Applied and Environmental Micro- biology 59: 1294-1302.
-
24. Giovannoni SJ, Tripp HJ, Givan S, Podar M, Vergin KL, Baptista D, Bibbs L, Eads J, Richardson TH, Noordewier M, Rappé MS, Short JM, Carrington JC, Mathur EJ. 2005. Genome Stream- lining in a Cosmopolitan Oceanic Bacterium. Science 309: 1242-1245.
-
25. Giovannoni SJ, Vergin KL. 2012. Seasonality in ocean microbial communities. Science 335: 671-676.
-
26. Glöckner FO, Kube M, Bauer M, Teeling H, Lombardot T, Ludwig W, Gade D, Beck A, Borzym K, Heitmann K. 2003. Complete genome sequence of the marine planctomycete Pirellula sp. strain 1. Proceedings of the National Academy of Sciences 100: 8298-8303.
-
-
28. Guilini K, Oevelen DV, Soetaert K, Middelburg JJ, Vanreusela A. 2010. Nutritional importance of benthic bacteria for deep-sea nematodes from the Arctic ice margin: Results of an isotope tracer experiment. Limnology and Oceanography 55: 1977-1989.
-
29. Henson MW, Lanclos VC, Faircloth BC, Thrash JC. 2018. Cultivation and genomics of the first freshwater SAR11 (LD12) isolate. bioRxiv, 093567.
-
30. Ichiye T. 1984. Some problems of circulation and hydrography of the Japan Sea and the Tsushima Current, Elsevier ocean- ography series. Elsevier, pp 15-54.
-
31. Jenkins C, Kedar V, Fuerst JA. 2002. Gene discovery within the planctomycete division of the domain Bacteria using se- quence tags from genomic DNA libraries. Genome Biology 3: research0031.
-
32. Kirchman DL. 2002. The ecology of Cytophaga-Flavobacteria in aquatic environments. FEMS Microbiology Ecology 39: 91-100.
-
33. Ladau J, Sharpton TJ, Finucane MM, Jospin G, Kembel SW, O'dwyer J, Koeppel AF, Green JL, Pollard KS. 2013. Global marine bacterial diversity peaks at high latitudes in winter. The ISME Journal 7: 1669.
-
34. Lauro FM, McDougald D, Thomas T, Williams TJ, Egan S, Rice S, DeMaere MZ, Ting L, Ertan H, Johnson J, Ferriera S, Lapidus A, Anderson I, Kyrpides N, Munk AC, Detter C, Han CS, Brown MV, Robb FT, Kjelleberg S, Cavicchioli R. 2009. The genomic basis of trophic strategy in marine bacteria. Pro- ceedings of the National Academy of Sciences 106: 15527-15533.
-
35. Lavy A, Keren R, Yu K, Thomas BC, Alvarez-Cohen L, Banfield JF, Ilan M. 2018. A novel Chromatiales bacterium is a potential sulfide oxidizer in multiple orders of marine sponges. Environ- mental Microbiology 20: 800-814.
-
36. Mizuno CM, Rodriguez-Valera F, Ghai R. 2015. Genomes of plank- tonic acidimicrobiales: widening horizons for marine actino- bacteria by metagenomics. MBio 6: e02083-02014.
-
37. Moeseneder MM, Arrieta JM, Muyzer G, Winter C, Herndl GJ. 1999. Optimization of Terminal-Restriction Fragment Length Polymorphism Analysis for Complex Marine Bacterioplankton Communities and Comparison with Denaturing Gradient Gel Electrophoresis. Applied and Environmental Microbiology 65: 3518-3525.
-
38. Moriarty DJW, Skyring GW, O'Brien GW, Heggie DT. 1991. Hetero- trophic bacterial activity and growth rates in sediments of the continental margin of eastern Australia. Deep Sea Research Part A. Oceanographic Research Papers 38: 693-712.
-
39. Morris R, Longnecker K, Giovannoni S. 2006. Pirellula and OM43 are among the dominant lineages identified in an Oregon coast diatom bloom. Environmental Microbiology 8: 1361-1370.
-
40. Morris RM, Rappé MS, Connon SA, Vergin KL, Siebold WA, Carlson CA, Giovannoni SJ. 2002. SAR11 clade dominates ocean surface bacterioplankton communities. Nature 420: 806.
-
41. Mullins TD, Britschgi TB, Krest RL, Gioivannoni SJ. 1995. Genetic comparisons communities. Limnology and Oceanography 40: 148-158.
-
42. Oksanen J, Blanchet FG, Kindt R, Legendre P, Minchin PR, O'hara R, Simpson GL, Solymos P, Stevens MHH, Wagner H. 2013. Package 'vegan'. Community ecology package, version 2.
-
43. Onitsuka G, Yanagi T, Yoon JH. 2007. A numerical study on nutrient sources in the surface layer of the Japan Sea using a coupled physical-ecosystem model. Journal of Geophysical Research: Oceans 112.
-
44. Pommier T, Neal PR, Gasol JM, Coll M, Acinas SG, Pedrós-Alió C. 2010. Spatial patterns of bacterial richness and evenness in the NW Mediterranean Sea explored by pyrosequencing of the 16S rRNA. Aquatic Microbial Ecology 61: 221-233.
-
45. Price PB, Sowers T. 2004. Temperature dependence of metabolic rates for microbial growth, maintenance, and survival. Pro- ceedings of the National Academy of Sciences of the United States of America 101: 4631-4636.
-
46. Pujalte MJ, Lucena T, Ruvira MA, Arahal DR, Macián MC. 2014. The Family Rhodobacteraceae, in: Rosenberg E, DeLong EF, Lory S, Stackebrandt E, Thompson F. (Eds.), The Prokaryotes: Alphaproteobacteria and Betaproteobacteria. Springer Berlin Heidelberg, Berlin, Heidelberg, pp 439-512.
-
47. Quast C, Pruesse E, Yilmaz P, Gerken J, Schweer T, Yarza P, Peplies J, Glöckner FO. 2013. The SILVA ribosomal RNA gene database project: improved data processing and web-based tools. Nucleic Acids Research 41: D590-D596.
-
48. R Core Team, 2018. R: A Language and Environment for Statistical Computing. R Foundation for Statistical Computing, Vienna, Austria. https://www.R-project.org/.
-
49. Ravenschlag K, Sahm K, Amann R. 2001. Quantitative molecular analysis of the microbial community in marine Arctic sedi- ments (Svalbard). Applied and Environmental Microbiology 67: 387-395.
-
-
51. Rothberg BEG, Rothberg JM. 2015. Massively Parallel ("Next-Generation") DNA Sequencing. Clinical Chemistry 61: 997-998.
-
52. Schloss PD, Westcott SL, Ryabin T, Hall JR, Hartmann M, Hollister EB, Lesniewski RA, Oakley BB, Parks DH, Robinson CJ, Sahl JW, Stres B, Thallinger GG, Van Horn DJ, Weber CF. 2009. Introducing mothur: Open-Source, Platform-Independent, Community-Supported Software for Describing and Com- paring Microbial Communities. Applied and Environmental Microbiology 75: 7537-7541.
-
53. Sekiguchi H, Watanabe M, Nakahara T, Xu B, Uchiyama H. 2002. Succession of Bacterial Community Structure along the Changjiang River Determined by Denaturing Gradient Gel Electrophoresis and Clone Library Analysis. Applied and Environmental Microbiology 68: 5142-5150.
-
54. Seo J-H, Kang I, Yang S-J, Cho J-C. 2017. Characterization of spatial distribution of the bacterial community in the South Sea of Korea. PLOS ONE 12: e0174159.
-
55. Sogin ML, Morrison HG, Huber JA, Welch DM, Huse SM, Neal PR, Arrieta JM, Herndl GJ. 2006. Microbial diversity in the deep sea and the underexplored "rare biosphere". Proceedings of the National Academy of Sciences 103: 12115-12120.
-
56. Sundararaman A, Lee S-S. 2017. Lutibacter oceani sp. nov., iso- lated from marine sediment in South Korea. Antonie van Leeuwenhoek 110: 45-51.
-
57. Teramoto M, Nishijima M. 2014. Amylibacter marinus gen. nov., sp. nov., isolated from surface seawater. International Journal of Systematic and Evolutionary Microbiology 64: 4016-4020.
-
58. Wagner M, Horn M. 2006. The Planctomycetes, Verrucomicrobia, Chlamydiae and sister phyla comprise a superphylum with biotechnological and medical relevance. Current Opinion in Biotechnology 17: 241-249.
-
59. Walsh EA, Kirkpatrick JB, Rutherford SD, Smith DC, Sogin M, D'Hondt S. 2015. Bacterial diversity and community com- position from seasurface to subseafloor. The ISME Journal 10: 979.
-
60. Wang YP, Gu J-D. 2006. Degradability of dimethyl terephthalate by Variovorax paradoxus T4 and Sphingomonas yanoikuyae DOS01 isolated from deep-ocean sediments. Ecotoxicology 15: 549-557.
-
61. Yoon J-H, Kang S-J, Oh T-K. 2006. Variovorax dokdonensis sp. nov., isolated from soil. International Journal of Systematic and Evolutionary Microbiology 56: 811-814.
-
62. Žure M, Munn CB, Harder J. 2015a. Diversity of Rhodopirellula and related planctomycetes in a North Sea coastal sediment employing carB as molecular marker. FEMS Microbiology Letters 362.
-
63. Žure M, Munn CB, Harder J. 2015b. Diversity of Rhodopirellula and related planctomycetes in a North Sea coastal sediment employing carB as molecular marker. FEMS Microbiology Letters 362: fnv127-fnv127.
Copyright (C) 2024. The Korean Society of Marine Life Science