


JMLS 2018 December;3(2):81-86. http://jmls.or.kr Epub 2018 December 17
Copyright © 2018 by The Korean Society of Marine Life Science
Hematological Characteristics of the Cultured Eel, Anguilla japonica by Vibration Stress
Dae-Hee Kim; Inland Fisheries Research Institute, NIFS, Gapyeong-gun 12453, Korea
Myung-Mo Nam; Inland Fisheries Research Institute, NIFS, Gapyeong-gun 12453, Korea
Si-Woo Lee; Inland Fisheries Research Institute, NIFS, Gapyeong-gun 12453, Korea
Kyoung Ho Kang; Division of Marine Techonology, Chonnam National University, Yeosu 59626, Korea
Yue Jai Kang; Department of Aquatic Life Medical Sciences, Sunmoon University, Asan-si 31460, Korea
Jun Wook Hur; Bio-Monitoring Center, Sejeong 30121, Korea
- Abstract
The purpose of this study is to determine the effects of vibration on primary (e.g. plasma cortisol), secondary (e.g. plasma glucose, aspartate aminotransferase (AST), alanine aminotransferase (ALT), Na+, K+ and Cl- and tertiary (e.g. mortality) stress responses in cultured eel, Anguilla japonica. For this purpose, three groups (including one control group and two stress groups) were set up. The control group was made exposed to vibration corresponding to 48 decibel (dB, V) (produced using electric vibrators) for 15 minutes per hour every day, and the two stress groups was made exposed to vibration corresponding to 58 and 68 dB (V) (produced using the same electric vibrators), equally, for 15 minutes per hour every day. Blood was sampled at day 0 (before starting vibration stress tests, BS), and days 1, 3, 5, 7, 9 and 11 (after starting vibration stress tests). As a result, plasma cortisol showed trend to continuously rise by consecutive stress from 4.1±0.1 ng/ml in BS. In 48 dB group (control), cortisol showed the highest level with 7.6±0.9 ng/ml after 7 days (p<0.05), but at 9 and 11 days was not significantly compared with BS level. In 58 dB group, the cortisol showed the highest level with 43.1±4.8 ng/ml after 1st day. Cortisol of 68 dB group increased significantly during the experimental period (14.4±2.3~32.0±5.7 ng/ml) (p<0.05). In 58, and 68 dB groups during the experimental period differed significantly compared to 48 group (p<0.05). Glucose in 48 dB were increased from 42.0±5.7 (BS) to 52.5±2.1 (1 day), the level was not significantly from 1 to 11 days. Glucose in 58 and 68 dB groups was increased significantly than BS during experimental period (p<0.05). K+ in 68 dB increased significantly (p<0.05) from 2.3±0.2 mE/ql (BS) to 3.3±0.5 mE/ql at 5 days. In 48 and 58 dB groups during the experimental period differed significantly (p<0.05). Na+ and Cl- levels were not differed significantly during the experimental period. AST and ALT in 58 and 68 dB groups showed trend to continuously rise by consecutive stress. At 7 and 9 days in AST, between 48, 58 and 68 dB groups differed significantly (p<0.05). In 48, 58 and 68 dB groups at 1 day, blood hematocrit increased significantly higher than BS. The 11 days after vibration stress, the mortality in 48, 58 and 68 dB groups was 1.1, 5.1 and 5.8%, respectively. The present results have shown that A. japonica exhibited ''typical'' physiological responses when exposed to chronic vibration stress. These data suggested that chronic vibration stress caused substantial stress in the fish; especially the persisting elevated plasma AST and ALT levels observed would be expected to adverse effect. In conclusion, chronic vibration stress could greatly affects the hematological characteristics in A. japonica.
Keywords: Eel Anguilla japonica Vibration stress Hematological character
Correspondence to: Jun Wook Hur; Bio-Monitoring Center, Sejeong 30121, Korea; E-mail : junwhur@hanmail.net;
- Received
- 19 November 2018;
- Revised
- 30 November 2018;
- Accepted
- 6 December 2018.
This is an Open Access article distributed under the terms of the Creative Commons Attribution Non-Commercial License (http://creativecommons.org/licenses/by-nc/3.0/) which permits unrestricted non-commercial use, distribution, and reproduction in any medium, provided the original work is properly cited.
Language: English,
Full Text:

Introduction
A. japonica distributes widely in eastern Asia, mainly in Korea, China, and Japan freshwater system. And it is one of the important indoors culture species in Korea. On the average, A. japonica farm mainly locates in a quiet place with good water condition.
Recently a lot of vibration arose from the development of industrialization and urbanization, roadwork and industrial establishment, this has made serious harmful effect on nearby aquaculture farm (Lee et al., 2006; Lee et al., 2007; Lee and Hur, 2004; Hur et al., 2009; Hur and Lee, 2010; Hur et al., 2015). These construction work mainly started from spring and ended in autumn so can affect the neighboring A. japonica farm obviously. Now there was report about the bad influence of vibration on soft-shelled turtle, Pelodiscus sinensis, catfish, Silurus asotus and A. japonica (Lee et al., 2007; Lee and Hur, 2004; Hur et al., 2009; Hur and Lee, 2010; Park and Yoon, 2017), however there is little research on A. japonica.
The total production of cultured freshwater fish was 36,160 M/T in Korea in 2017, in which the production of A. japonica accounted for 31.0%, about 11,067 M/T (Korean Statistical Information Service, 2017). The production of cultured A. japonica has increased from 8,021 M/T (2010) to 9,904 M/T (2016). Compared to other fresh- water fish, A. japonica culturing has been increasing gradually, as well as the consumption.
Accordingly there is little report on the hematological characteristics to the vibration stress in culture environment domestic and overseas, there is a need to do some research in this field. This study has investigated a short period index for the stress responses: the primary (plasma cortisol), secondary (plasma glucose, AST, ALT, Na+, K+ and Cl-), and tertiary (mortality).
Materials and Methods
A. japonica (mean length: 22.9±0.9 cm, mean weight: 295.5±65.5 g, ± SD, n=66) obtained from research station, Kunsan National University, Korea. They were habituated in a lab aquarium tank for 2 weeks before used in the study. The A. japonica (n=450) were distributed in 9 tanks (2 ton, FRP, raceway style) by experimental scheme, and an electric vibrator was attached to one end-side of tank outer.
The non-stress group (control) of 48 dB (V), stress groups of 58 and 68 dB (V) from an electric vibrator were turned on for 15 min per one hour during 11 days. In order to exclude other stresses, the lab was constantly kept dark, with no other disturbances, and the water temperature was automatically regulated from 24.5 to 25.5℃ using a temperature control system. The A. japonica in the non-stressed group (n=50) were maintained under the same environmental conditions excluding vibration for 11 days.
Blood was sampled during 1 min without anesthesia from the caudal blood vessel complex using heparinized syringes at day 0 (before start of the experiment, BE), and at 1, 3, 5, 7, 9, and 11 days after vibration stress.
Hematocrit, red blood cells (RBC) and hemoglobin were analyzed immediately using an automatic blood analyzer (Excell 500, Danam Electronics, Dallas, TX, USA). Blood samples were kept in 2-ml vacuum containers treated with sodium fluoride/potassium oxalate (Vacutainer, UK) and in 1.5-ml polypropylene microcentrifuge tubes held on ice for less than 5 min before centrifugation at 5,600 g for 5 min. Plasma was then collected and stored in a deep freeze (CLN-500 UW Nihon Freezer; Nihon Co., Japan) at -70℃ until analysis.
Plasma cortisol concentration was determined in 50-μl samples using radioimmunoassay kits (Coat-A-Count TKCO Cortisol RIA Kit; DPC, USA). Mixtures of samples in 100 ml of antiserum were incubated for 45 min at 37℃, and then, 1,000 ml of separation reagent was added. The mixtures were placed in a refrigerator at 4℃ for 15 min and then centrifuged at 1,200 g for 15 min. The supernatant was assayed for gamma radiation using an automatic gamma counter (Cobra Ⅱ; Packard Co., USA). Plasma glucose, AST (aspartate aminotransferase) and ALT (alanine aminotransferase), Na+, K+ and Cl- were analyzed using an automatic chemistry analyzer (Hitachi 7180, Hitachi, Japan).
Experiment was performed in triplicate and results were reported as means ± SD (n=5) unless otherwise stated. Data were analyzed by a one-way ANOVA in the SPSS (Statistical Package for Social Sciences) statistical package. Means were separated by using Duncan's multiple range test and were considered significantly different if p<0.05.
Results
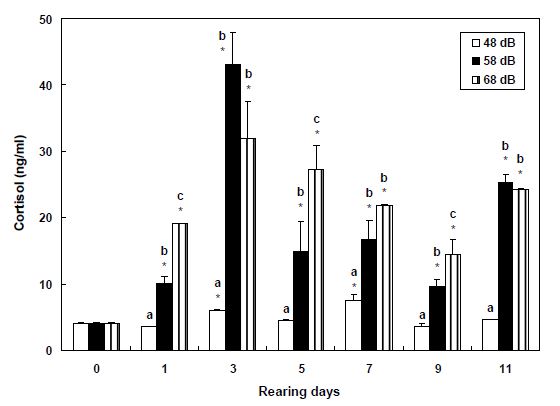
Plasma cortisol showed trend to continuously rise by consecutive stress from 4.1±0.1 ng/ml in BE (Fig. 1). In 48 dB group (control), cortisol showed the highest level with 7.6±0.9 ng/ml after 7 days (p<0.05), but at 9 and 11 days was not significantly compared with BE level. In 58 dB group, the cortisol showed the highest level with 43.1±4.8 ng/ml after 1st day. Cortisol of 68 dB group increased significantly during the experimental period (14.4±2.3~32.0±5.7 ng /ml) (p<0.05). In 58, and 68 dB groups during the experimental period differed significantly compared to 48 group (p<0.05).
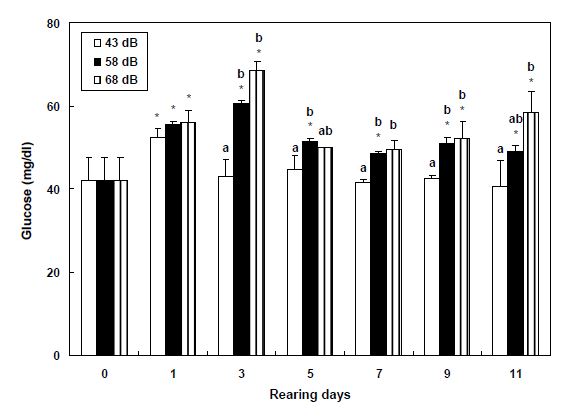
Plasma glucose in 48 dB were increased from 42.0±5.7 (BE) to 52.5±2.1 (1 day), the level was not significantly from 1 to 11 days (Fig. 2). Glucose in 58 and 68 dB groups was increased significantly than BE during experimental period (p<0.05).
Plasma K+ in 68 dB increased significantly (p<0.05) from 2.3±0.2 mE/ql (BE) to 3.3±0.5 mE/qL at 5 days (Table 1). In 48 and 58 dB groups during the experimental period differed significantly (p<0.05). Na+ and Cl- levels were not differed significantly during the experimental period.
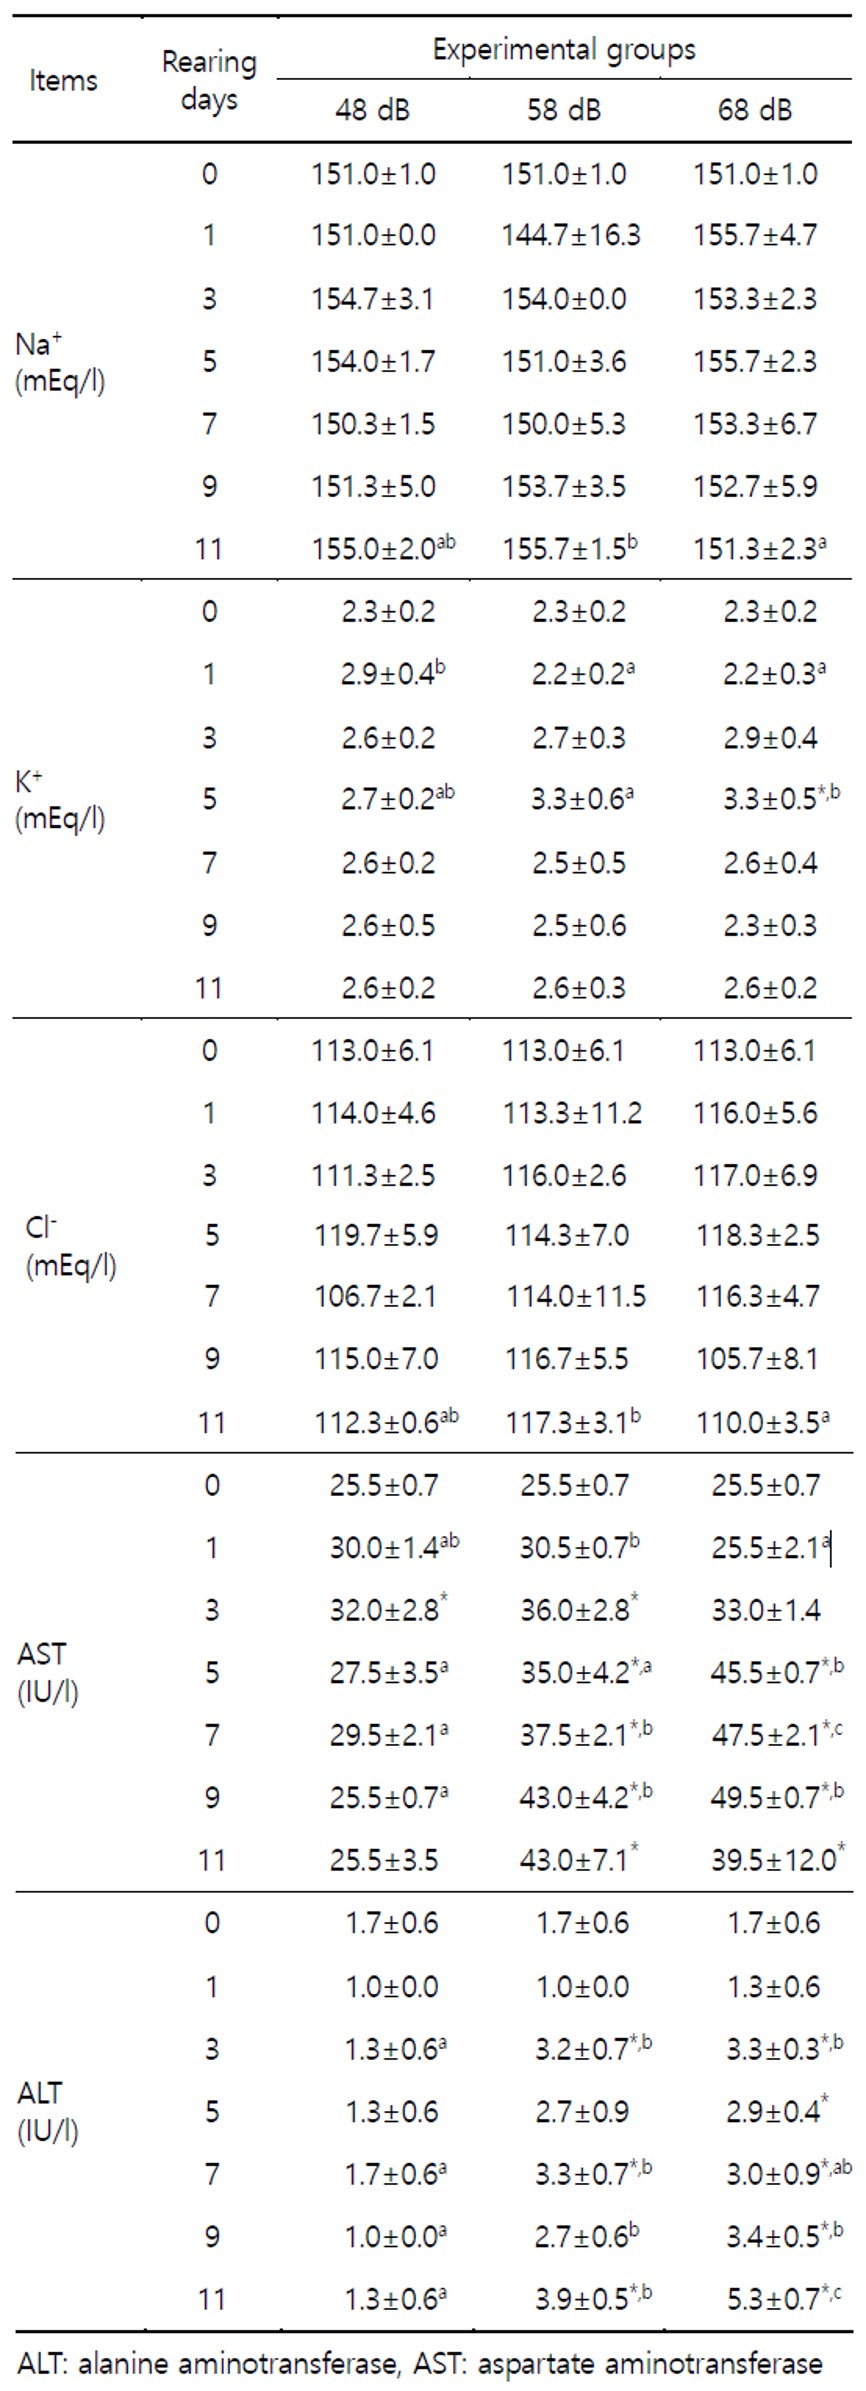
Plasma AST and ALT in 58 and 68 dB groups showed trend to continuously rise by consecutive stress. At 7 and 9 days in AST, between 48, 58 and 68 dB groups differed significantly (p<0.05).
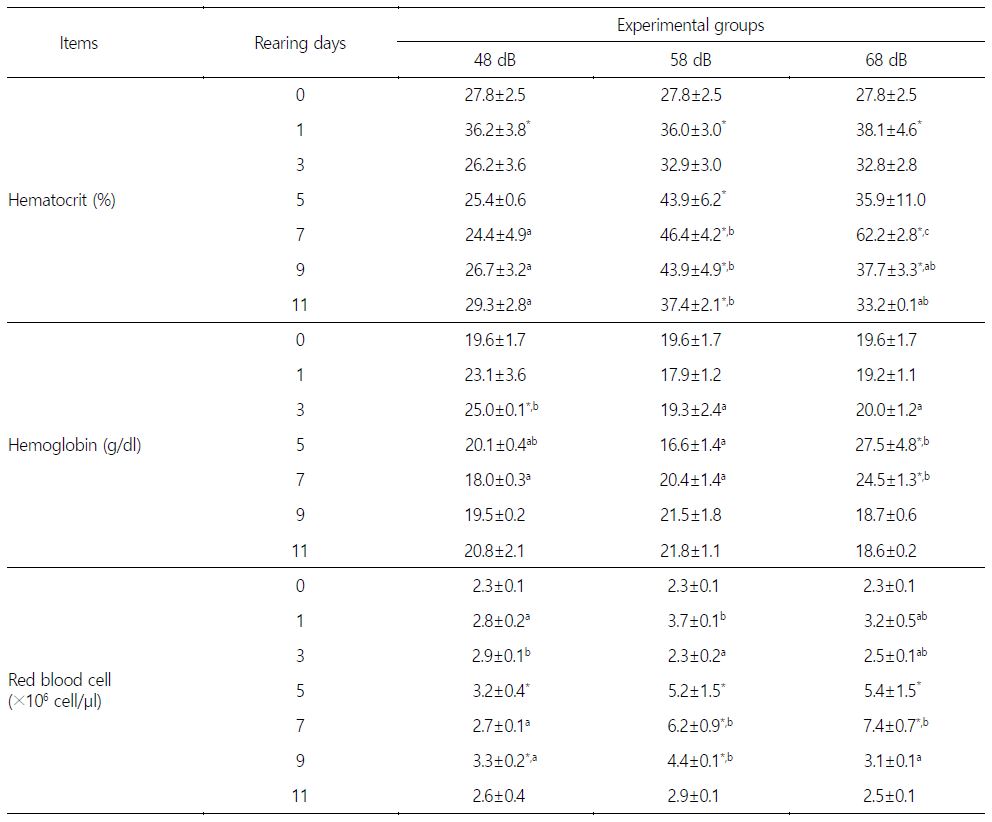
Table 2 shows the variations of RBC, hematocrit and hemoglobin in plasma to a vibration stress for 11 days. In 48, 58 and 68 dB groups at 1 day, hematocrit was increased significantly higher than BE.
The 11 days after vibration stress, the mortality in 48, 58 and 68 dB groups was 1.1, 5.1 and 5.8%, respectively (no data).
Discussion
In this study, we knew cortisol as a stress index in blood would increase when received stress. The change of cortisol in all experiments was higher than the control at the first day of experiment when given vibration stress. Cortisol at 7 days was still higher than the control at 48 dB group, but when it came to 9 and 11 days the cortisol got back to normal. However, the cortisol didn't recover until the end of the experiment at 58 and 68 dB groups. During the 11 days fish had accepted considerable affect at the continual vibration stimulus. The content of glucose in blood rose with the increasing of cortisol was the general reaction to stress (Barton and Iwama, 1991).
In this study glucose rose with the increasing of cortisol for the stress affection, this needed much energy. Olive flounder, Paralichthys olivaceus, after once acute stress, the variation of cortisol will get back to normal value of 24 hours ago (Hur, 2002; Lim and Hur, 2018). But in this study the vibration stress repeated every day so we could decide the affection at the continuous trend. Moreover the variation of cortisol and glucose on the first day was generally something like the reaction to stress. And the value of cortisol and glucose rose with the increasing of stress. In this experiment 48 dB group was a common vibration in aquaculture farm. Because the other conditions were different from the aqua farm so the same reaction didn't appear in aqua farm fish, in this study the reaction to stress continued to the 7 days.
Hence, some metabolic levels recovered within 24 hours, but a longer time would be required for normal metabolism to take place after fish have experienced stress. According to the report by Pickering (1993), complete physiological recovery from the stresses studied would take as long as 2 weeks.
Responses to stress-related disturbances in fish are often characterized as primary, secondary and tertiary (Hur, 2002). Primary response is the activation of brain centers that eventually results in the release of cortisol from the steroid-producing cells and of catecholamine from the chromaffin cells of the head kidney. Secondary responses are defined as the subsequent actions and effects of these hormones at blood and tissue level, and may include a disturbance of the hydromineral and metabolic balance. Tertiary responses, exemplified by inhibited growth, hampered reproduction and immune suppression, concern the performance of the organism.
In this study plasma AST and ALT had a trend like this (tertiary response). This result showed AST and ALT increased with experiment processing, so we can know whether there was affection on internal organs or not. AST and ALT are aminotransferases that are distributed in the liver and spleen. Levels are low when animals are healthy, but increase when tissue necrosis is present or animals become sick (Almeida et al., 2002). Davis and Parker (1990) reported that hemodynamic indices of oxygen carrying ability are increased by stress. In this research the value of AST and ALT showed a significant difference between the start and end, so we could know whether there was physiology burden on liver, spleen and other tissue at different vibration. The results of AST and ALT in this study were similar to that in a parallel experiment which conducted on P. sinensis (Lee et al., 2007).
Davis and Parker (1990) had reported the hematology index-oxygen transmission ability became high when suffered stress. Blood hematocrit, RBC and hemoglobin were the basic blood factors through which oxygen transformation ability could be estimated and in this study they also showed reaction to stress like other blood items accompany with vibration processing.
The decrease of hemoglobin content and RBC indicated that the oxygen supply and demand was in trouble because of stress. The decrease of hemoglobin content made the respiration quotient induce (Rodrigues et al., 1989), and decrease of hemoglobin and RBC in blood which in charge of oxygen receiving and transformation mean oxygen supply and demand was abnormal (Perry and Reid 1993), energy mobilization problems occurred. In case the stress was weak A. japonica would increase hemoglobin and RBC, oxygen supply and energy mobilization to overcome the stress. But when under the continuous stress, A. japonica was affected seriously and hemoglobin and RBC decreased for depressing of oxygen consumption. In the case of P. olivaceus, after temperature and transportation stress hemoglobin and RBC increased abruptly then got back to the beginning condition quickly (Chang et al., 2001; Hur et al., 2007, 2008, 2015). That was to say small stress like temperature, transportation and so on could cause blood characteristic disorder but recovered at once, in this study A. japonica couldn't adjust to the continuous stress and when this kind of stress acted on the fish it couldn't recover to the normal.
In this study we could see A. japonica had received a lot of stress through the analysis of blood index cortisol, glucose, AST, ALT, RBC and hemoglobin. A. japonica was bottom teleostei so they were more sensitive to the vibration and other kind of stress. This experiment had measured physiology activity and several variation items, but we still needs to measure more items and histology variation of internal organs and investigate mechanism different physiology activity variation in the future for the determination of physiology exhaustion under different stress.
- References
-
1. Almeida JA, Diniz YS, Marques SFG, Faine LA, Ribas BO, Burneiko RC, Novelli ELB. 2002. The use of the oxidative stress responses as biomarkers in Nile tilapia (Oreochromis niloticus) exposed to in vivo cadmium contamination. Environment International 27: 637-679.


-
2. Barton BA, Iwama GK. 1991. Physiological changes in fish from stress in aquaculture with emphasis on the response and effects of corticosteroids. Annual Review Fish Disease 1: 3-26.
-
3. Chang YJ, Hur JW, Lim HK, Lee JK. 2001. Stress in olive flounder (Paralichthys olivaceus) and fat cod (Hexagrammos otakii) by the sudden drop and rise of water temperature. Journal of Korean Fishers Society 34: 91-97.
-
4. Davis KB, Parker NC. 1990. Physiological stress in striped bass: effect of acclimation temperature. Aquaculture 91: 349-358.
-
5. Hur JW. 2002. Physiological responses of fishes to the artificial stresses in the process of aquaculture. PhD thesis, Pukyong National University, Busan. 196 pp.
-
6. Hur JW, Lee JY, Chang YJ, Bai SC, Park I-S. 2009. Effects of the vibration stress on cortisol and hematological characteristics in soft-shelled turtle, Pelodiscus sinensis. Development & Reproduction 13: 43-49.
-
7. Hur JW, Lim HK, Chang YJ. 2008. Effects of repetitive temperature changes on the stress response and growth of olive flounder, Paralichthys olivaceus. Journal of Applied Animal Research 33: 49-54.
-
8. Hur JW, Park I-S, Chang YJ. 2007. Physiological responses of olive flounder, Paralichthys olivaceus, to a series stress during transportation process. Ichthyological Research 54: 32-37.
-
9. Hur JW, Lee JY. 2010. Effects of chronic vibration stress on liver, kidney and testis of the soft-shelled turtle Pelodiscus sinensis. Journal of Applied Animal Research 37: 241-245.
-
10. Hur JW, Kim DH, Lee JY. 2015. Physiological responses to three different levels of vibration stress in catfish, Silurus asotus. Ecology and Resilient Infrastructure 2: 337-344.
-
11. Korean Statistical Information Service. 2017. Statistical year book of maritime affairs and fisheries. Statistics Korea.
-
12. Lee JY, Hur JW. 2004. Effect of vibration stress on the oxygen consumption, ammonia excretion and blood characteristics of the cultured eel, Anguilla japonica. Journal of Aquaculture 17: 262-267.
-
13. Lee JY, Sung YS, Hur JW. 2007. Oxygen consumption and ammonia excretion in cultured soft-shelled turtle, Pelodiscus sinensis exposed vibration stress. Journal of Aquaculture 20: 60-64.
-
14. Lee S, Kim SK, Rhee YH. 2006. Study of blast ground vibration and noise measurements in-situ and effect analysis for numerical analysis, rational blasting design at an eel farm. Journal Korean Society for Rock Mechanics 16: 179-188.
-
15. Lim HK, Hur JW. 2018. Effects of acute and chronic air exposure on growth and stress response of juvenile olive flounder, Paralichthys olivaceus. Turkish Journal of Fisheries and Aquatic Sciences 18: 143-151.
-
16. Park JH, Yoon JR. 2017. Overview of anthropogenic underwater sound effects and sound exposure criteria on fishes. Journal of the Korean Society of Fisheries and Ocean Technology 53: 19-40.
-
17. Perry SF, Reid SD. 1993. β-arenergic signal transduction in fish: interactive effects of catecholamines and cortisol. Fish Physi- ology and Biochemistry 11: 195-203.
-
-
19. Rodrigues AL, Bellinaso ML, Dick T. 1989. Effect of some metal ions on blood and liver delta-aminolevulinate dehydratase of Pimelodis maculata (Pisces, Pimelodidae). Comparative Biochemistry and Physiology 94: 65-69.
Copyright (C) 2024. The Korean Society of Marine Life Science